Fig. 7.
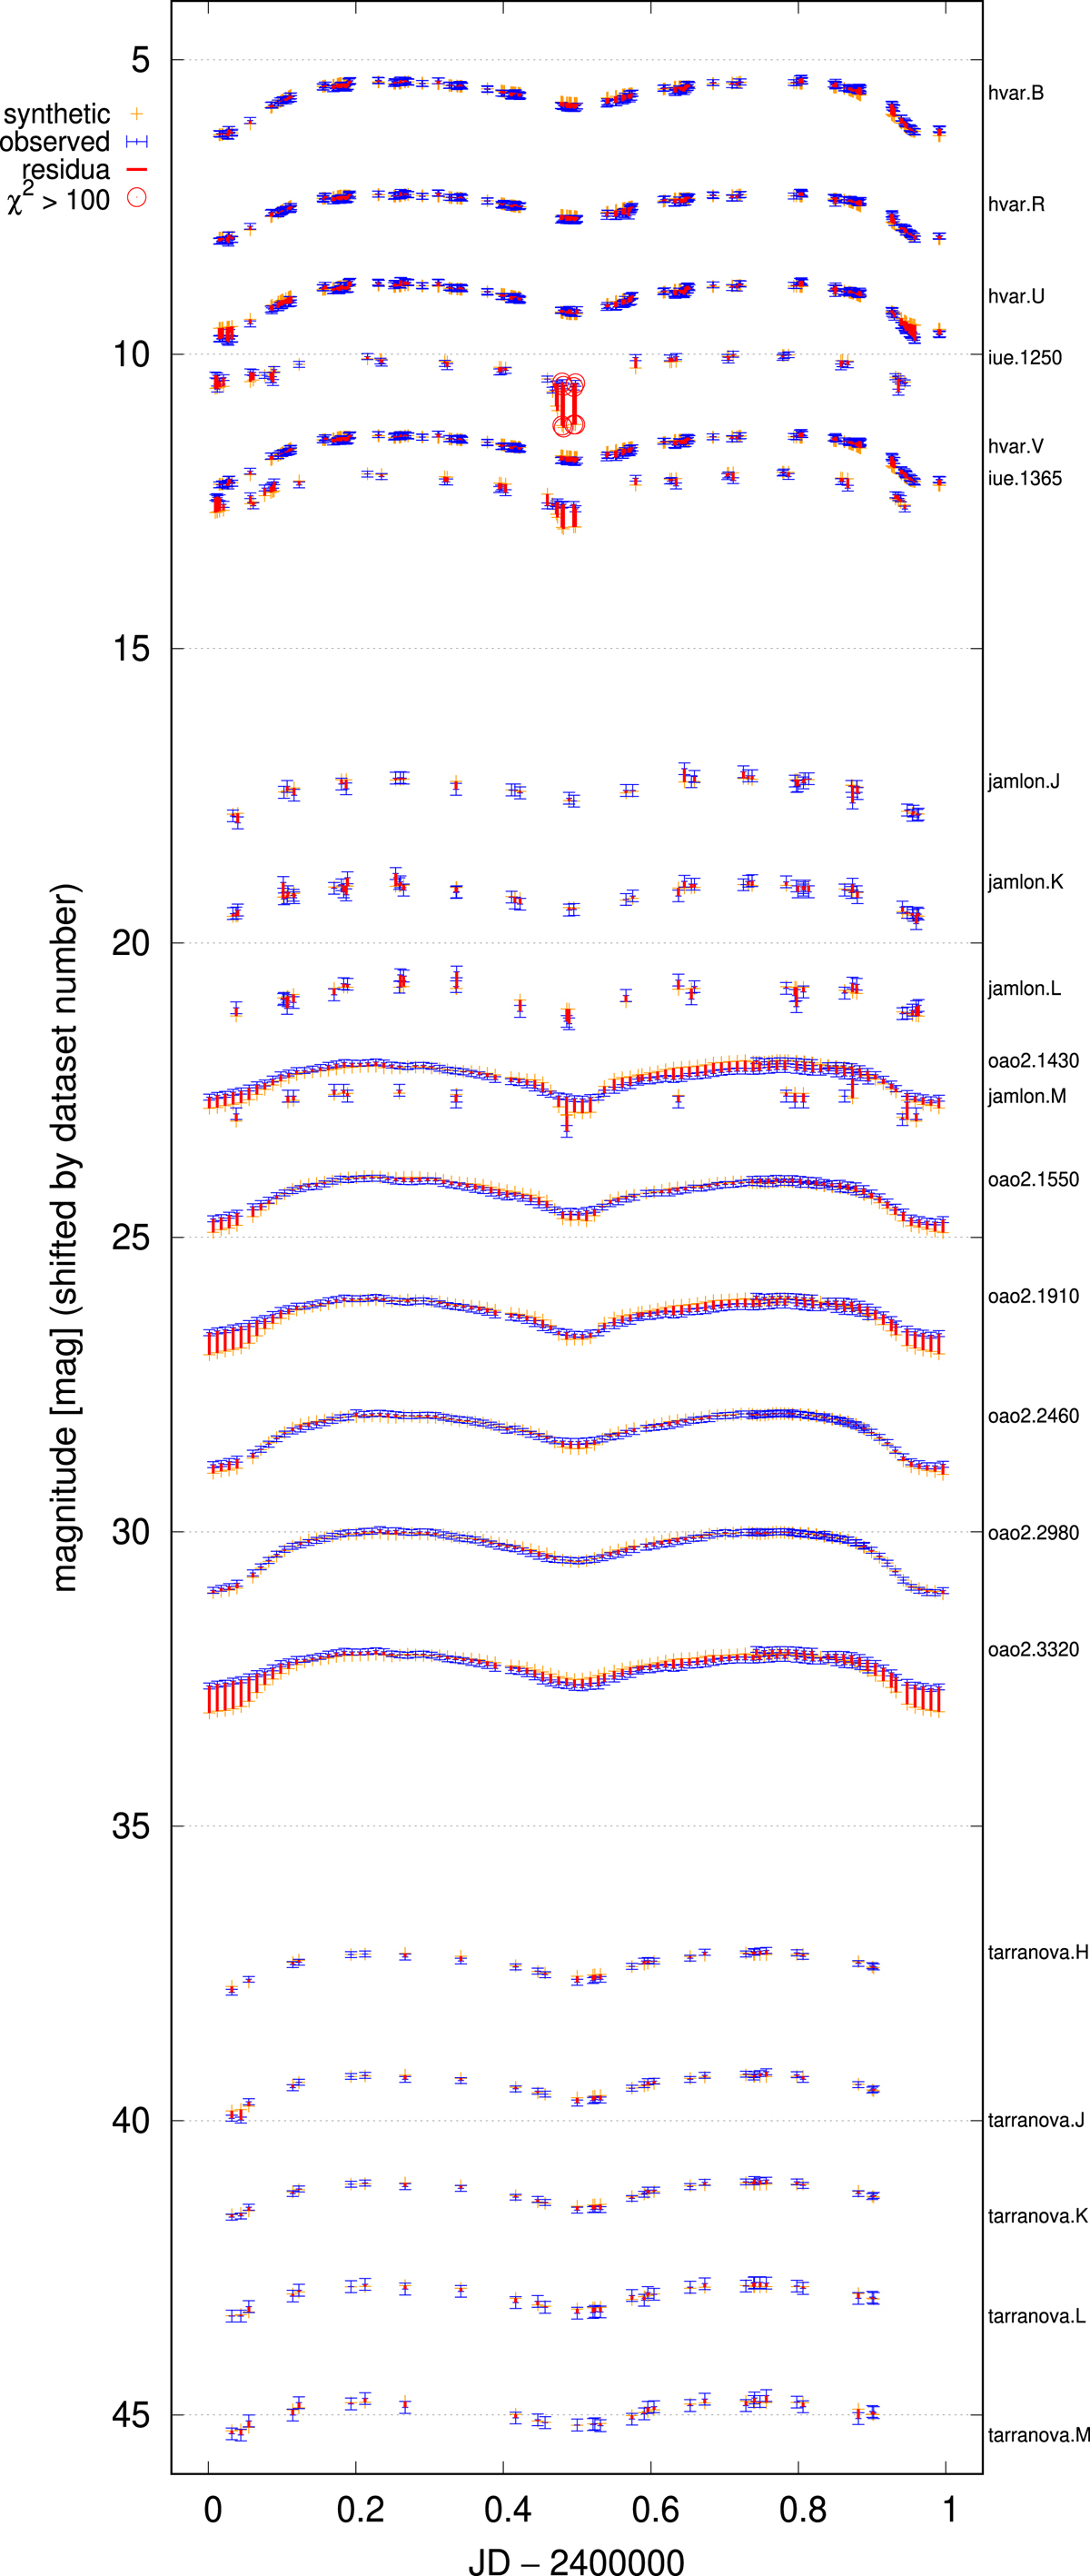
Observed and synthetic light curves of β Lyr A, shown for all 21 datasets (see their names in the right column). The light curves are phased according to 1. Vertical offsets are arbitrary. The best-fit model is again “nebula” with χ
2 = 103 233; the individual contribution arising from light curves comparison is ![]() . Synthetic data are denoted by yellow crosses, observed data by blue error bars, and residua by red lines (or circles). There are clear systematic differences especially for datasets iue.1250, iue.1365, oao2.1910, oao2.3320. At the same time, there are neighboring datasets matched relatively well. Sometimes, an intrinsic variability can be also seen (oao2.1430).
. Synthetic data are denoted by yellow crosses, observed data by blue error bars, and residua by red lines (or circles). There are clear systematic differences especially for datasets iue.1250, iue.1365, oao2.1910, oao2.3320. At the same time, there are neighboring datasets matched relatively well. Sometimes, an intrinsic variability can be also seen (oao2.1430).
Current usage metrics show cumulative count of Article Views (full-text article views including HTML views, PDF and ePub downloads, according to the available data) and Abstracts Views on Vision4Press platform.
Data correspond to usage on the plateform after 2015. The current usage metrics is available 48-96 hours after online publication and is updated daily on week days.
Initial download of the metrics may take a while.