Fig. 6.
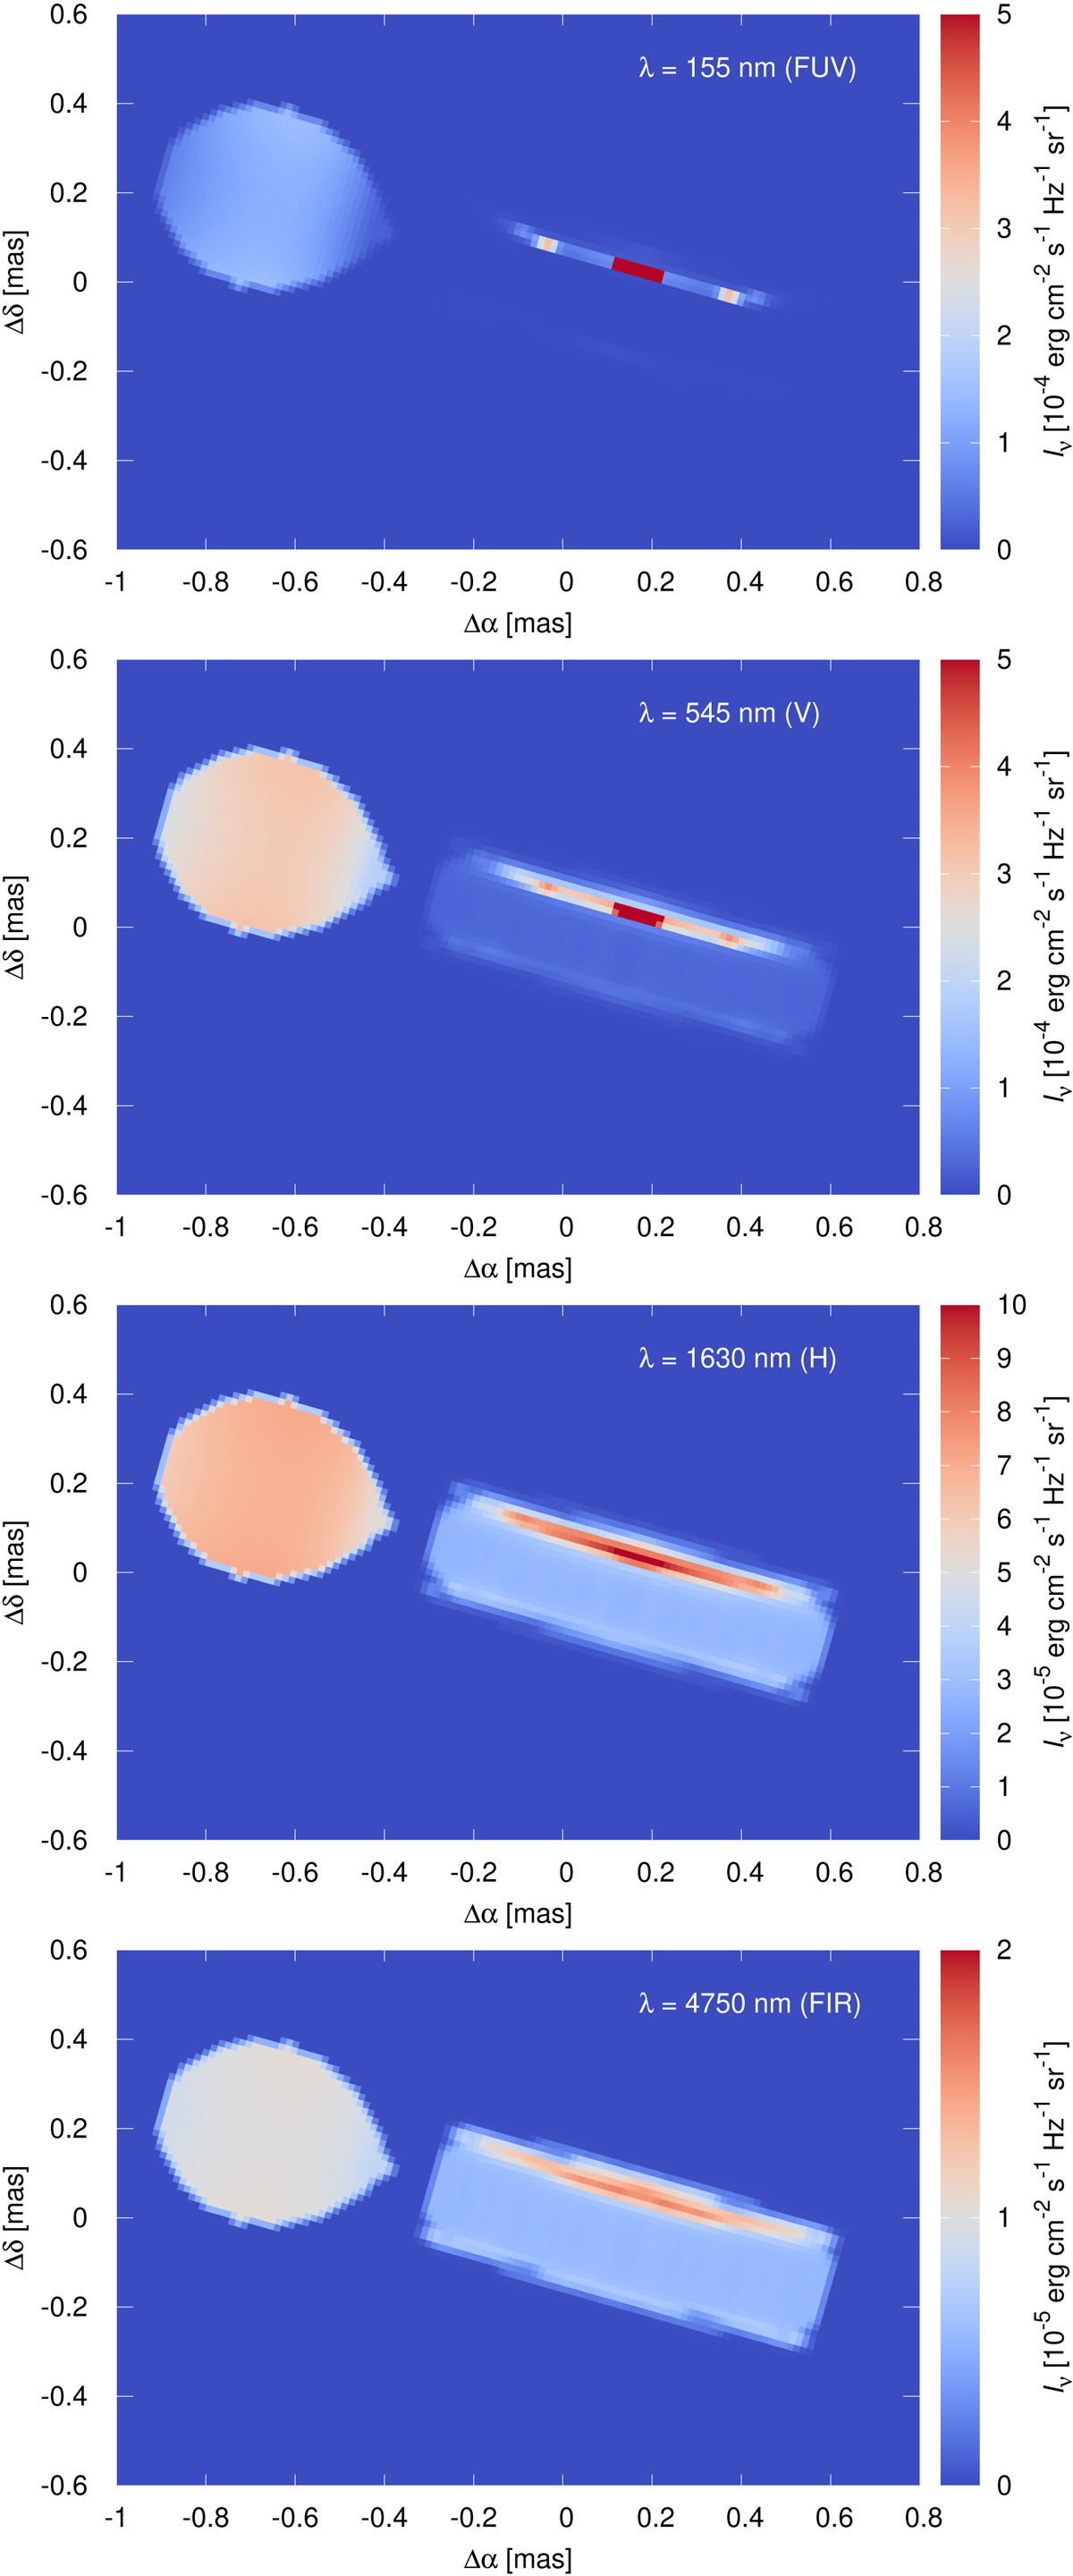
Synthetic images of β Lyr A for the best-fit nebula model, with total (not reduced) χ 2 = 103 233, shown for four different wavelengths: λ = 155 nm (FUV), 545 nm (V band), 1630 nm (H), and 4750 nm (M). The axes correspond to the right ascension α and declination δ (in mas), while the color scale corresponds to the monochromatic intensity Iv (in erg s−1 cm−2 sr−1 Hz−1). This is a small subset of all 2392 images (per one iteration) used to derive light curves, interferometric visibilities, closure phases, and triple product amplitudes.
Current usage metrics show cumulative count of Article Views (full-text article views including HTML views, PDF and ePub downloads, according to the available data) and Abstracts Views on Vision4Press platform.
Data correspond to usage on the plateform after 2015. The current usage metrics is available 48-96 hours after online publication and is updated daily on week days.
Initial download of the metrics may take a while.