Fig. 2.
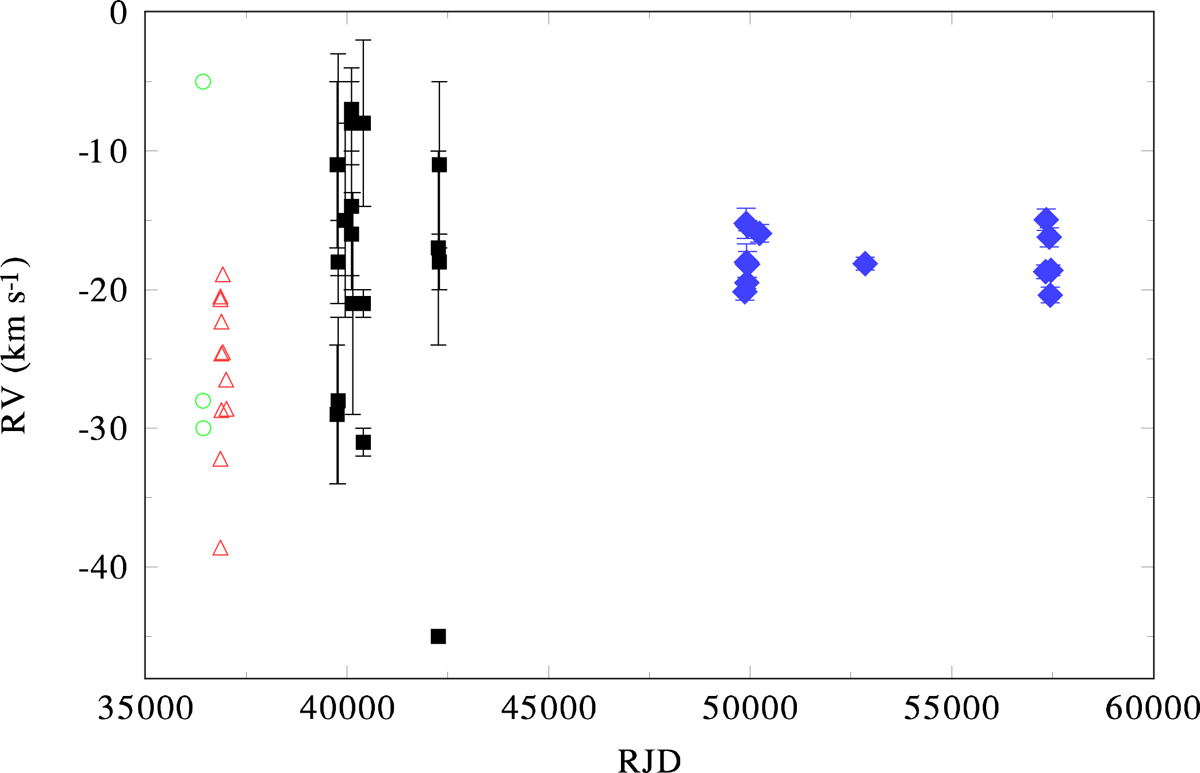
Available RVs of β Lyr B. The first three datasets are RVs measured on photographic spectra of moderate dispersion: green open circles denote the RVs measured by Petrie & Pearce (1961), the red open triangles come from Abt et al. (1962), and the black boxes are RVs from Abt & Levy (1976). The filled blue diamonds are the RVs measured on Ondřejov electronic spectra with PYTERPOL. The rms errors, available only for Abt & Levy (1976) and new RVs are also shown. We note that the most deviant RV of −45 km s−1 is based on a single line and comes probably from an underexposed spectrum.
Current usage metrics show cumulative count of Article Views (full-text article views including HTML views, PDF and ePub downloads, according to the available data) and Abstracts Views on Vision4Press platform.
Data correspond to usage on the plateform after 2015. The current usage metrics is available 48-96 hours after online publication and is updated daily on week days.
Initial download of the metrics may take a while.