Fig. C.1.
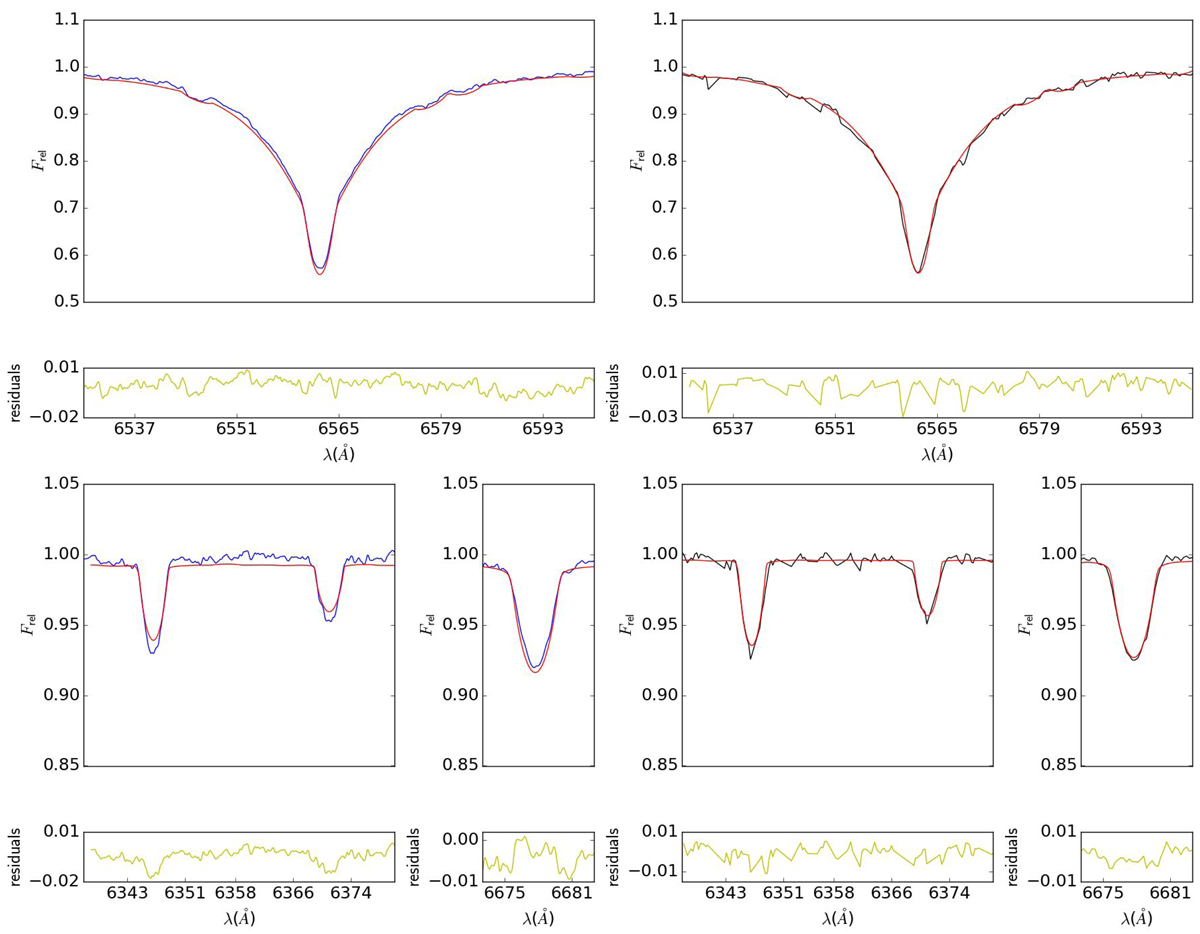
Comparison of an observed spectrum of β Lyr B obtained on RJD = 49866.4348 and disentangled spectra of β Lyr B with the best fitting spectra corresponding to their respective solutions listed in Table 3, that is synthetic spectra compared to observed spectrum correspond to slightly different parameters than those compared to disentangled spectra. The blue line denotes disentangled spectrum, the black line the observed spectrum, the red line best-fitting synthetic spectrum, and the yellow line fit residuals. Only principal spectral lines (Si II 6347 Å, Si II 6371 Å, Hα, He I 6678 Å) that are present within the studied spectral region Δλ ≃ 6200–6800 Å and their surroundings are plotted.
Current usage metrics show cumulative count of Article Views (full-text article views including HTML views, PDF and ePub downloads, according to the available data) and Abstracts Views on Vision4Press platform.
Data correspond to usage on the plateform after 2015. The current usage metrics is available 48-96 hours after online publication and is updated daily on week days.
Initial download of the metrics may take a while.