Fig. 1.
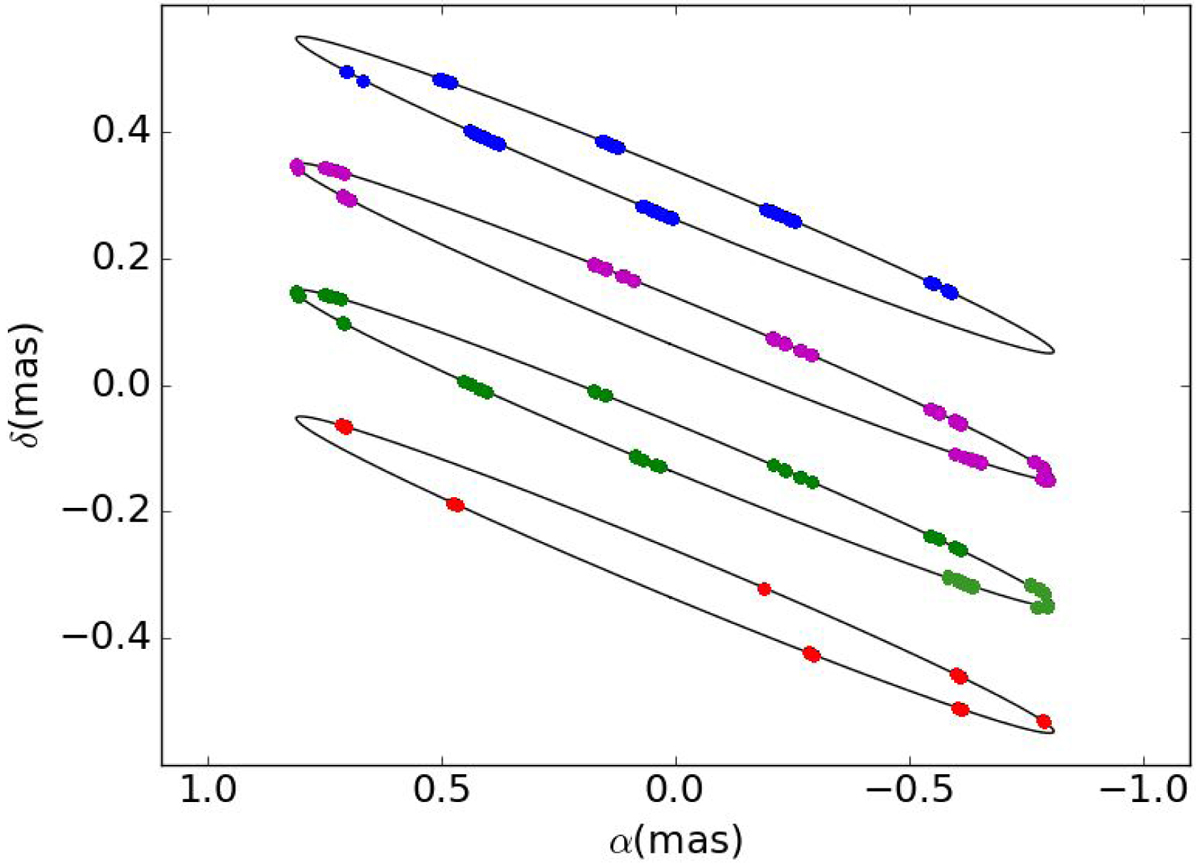
Phase coverage of spectro-interferometric observations of β Lyr acquired by different instruments. δ denotes the relative declination (positive toward the north), and α the relative right ascension (positive toward the east). The black line shows the size and orientation of the β Lyr orbit in the sky, the blue dots show orbital phases corresponding to NPOI observations, the magenta dots to CHARA/VEGA observations, the green dots to CHARA/MIRC observations acquired in 2013, and the red dots to CHARA/MIRC observations acquired in 2006/2007. An arbitrary vertical shift of 0.2 mas is added to separate the various orbits.
Current usage metrics show cumulative count of Article Views (full-text article views including HTML views, PDF and ePub downloads, according to the available data) and Abstracts Views on Vision4Press platform.
Data correspond to usage on the plateform after 2015. The current usage metrics is available 48-96 hours after online publication and is updated daily on week days.
Initial download of the metrics may take a while.