Fig. 6.
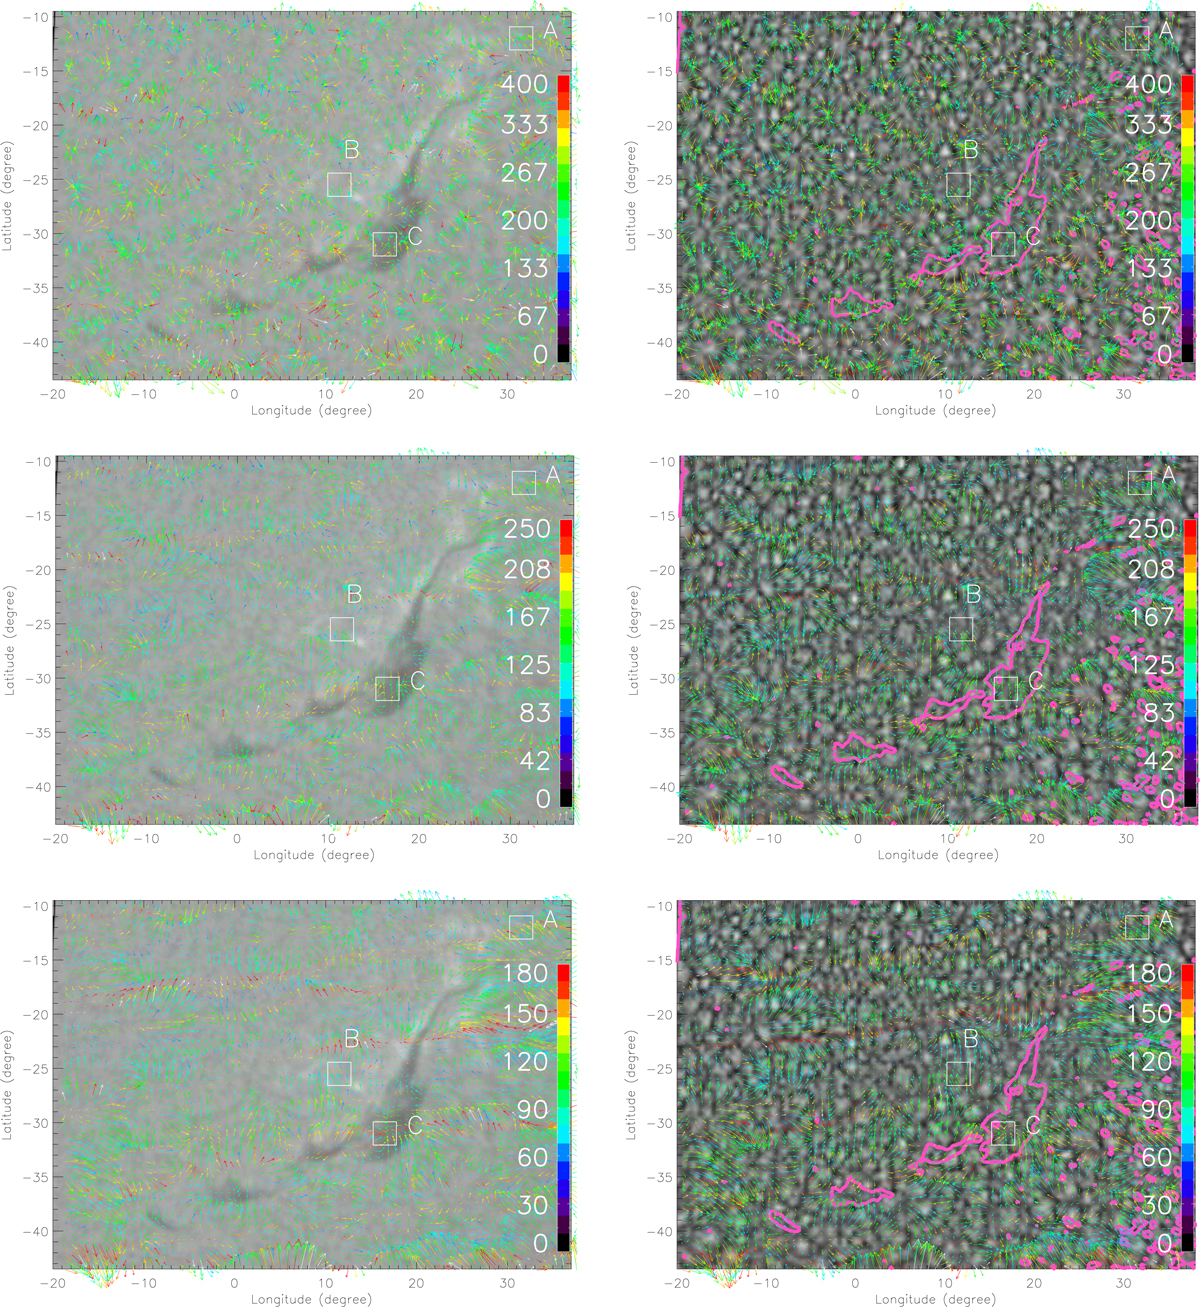
Flows (computed between 09 and 16 UT) below the filament with three different spatial resolutions: over an Hα image (16:42 UT) (left panels), over a divergence map (right panels). From top to bottom the spatial window used is 22 000 km, 44 000 km, and 66 000 km, respectively. The granules have been followed during seven hours. The velocity is ±0.400, 0.250 km s−1, and 0.180 km s−1 for the smaller to the largest windows. A, B, and C are the ends of the filament (see Fig. 1). The amplitudes of the velocity are reduced in the filament channel and are large on the west side of the filament. We see three lanes of strong flows from the west. The filament in Hα is indicated by pink contours in the right panels.
Current usage metrics show cumulative count of Article Views (full-text article views including HTML views, PDF and ePub downloads, according to the available data) and Abstracts Views on Vision4Press platform.
Data correspond to usage on the plateform after 2015. The current usage metrics is available 48-96 hours after online publication and is updated daily on week days.
Initial download of the metrics may take a while.