Fig. 5.
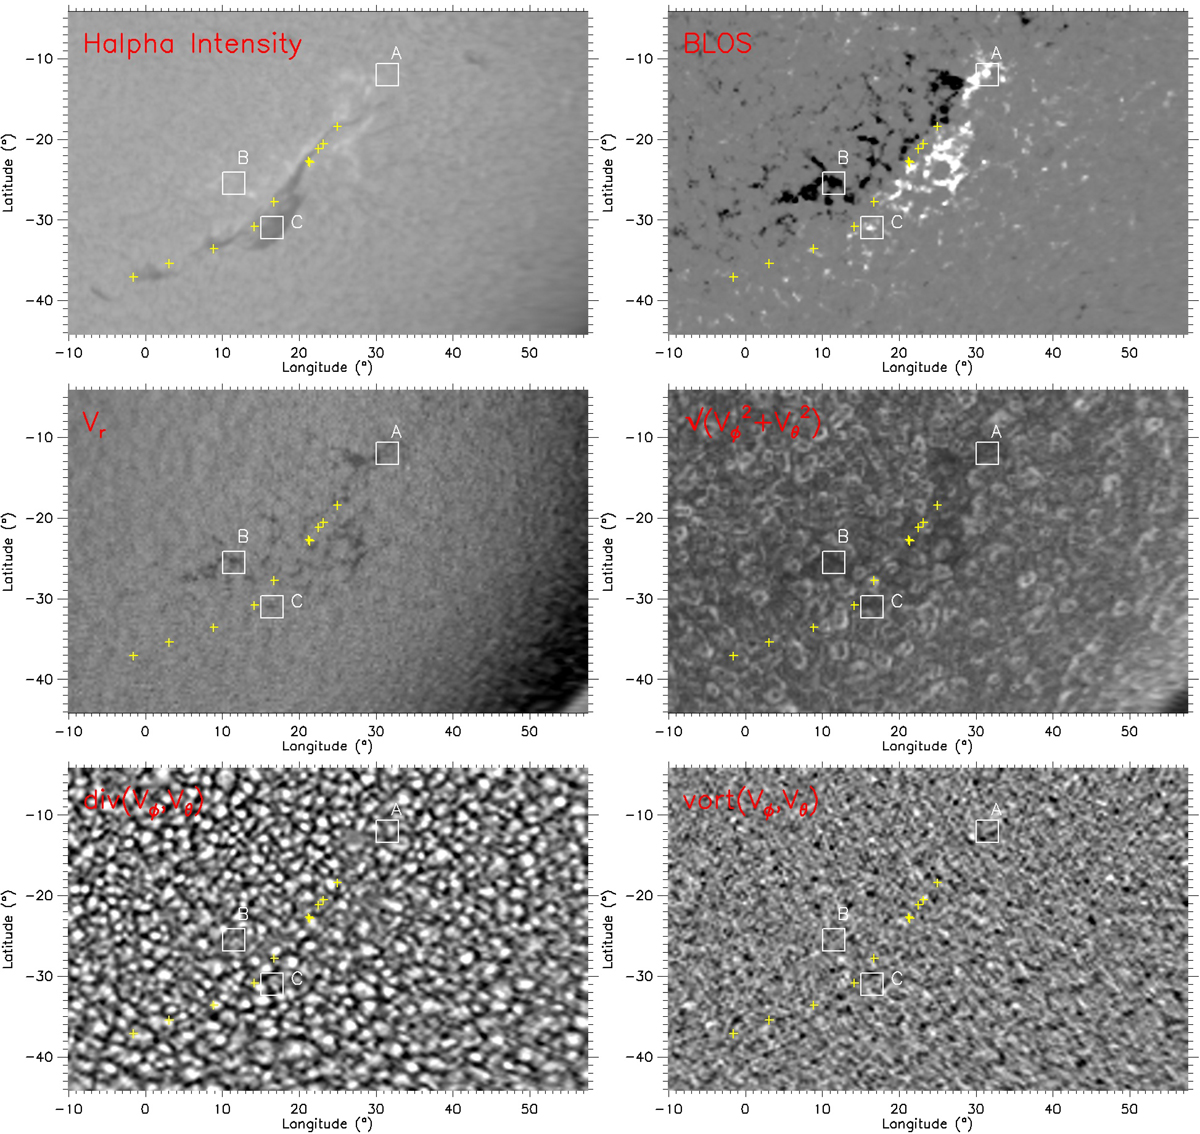
Top row left: Hα filament at 16:42 UT. The yellow crosses define the polarity inversion line (PIL); the temporal evolution is available online Movie 1. Top right: HMI magnetogram (averaged over 24 h). Middle row left: vr radial velocity (averaged over 24 h), white and dark indicating outgoing (positive) and ingoing (negative) radial velocity respectively, with the amplitude between 0.15 and −0.2 km s−1. Middle row right: vh horizontal velocity (averaged over 24 h). Bottom row left: divergence (averaged over 24 h) with a mean value of (3.6 × 10⁻⁴s−1) for positive divergence (white). Bottom row right: vorticity (averaged over 24 h), with a mean value of (3.35 × 10⁻⁴s−1), for positive vorticity (white). We note that the divergence is reduced in the filament channel around the PIL between A, B, and C (gray areas) and is nearly co-spatial with black areas in the vh modulus panel. In this map, we see the supergranular pattern except in the regions of black areas, which correspond to strong magnetic field regions. For the four bottom panels, the granules were followed during 24 h to increase the contrast. The temporal evolution of the filament in α is available as a movie online. The movie shows the full disk, and the data in the movie before 16:00 UT are from CLIMSO and after 16:00 UT from GONG. CLIMSO and GONG data are centered and resized to the same solar diameter. The images in the movie are de-rotated from the solar differential rotation, allowing us to follow the filament evolution at the same location.
Current usage metrics show cumulative count of Article Views (full-text article views including HTML views, PDF and ePub downloads, according to the available data) and Abstracts Views on Vision4Press platform.
Data correspond to usage on the plateform after 2015. The current usage metrics is available 48-96 hours after online publication and is updated daily on week days.
Initial download of the metrics may take a while.