Fig. 3.
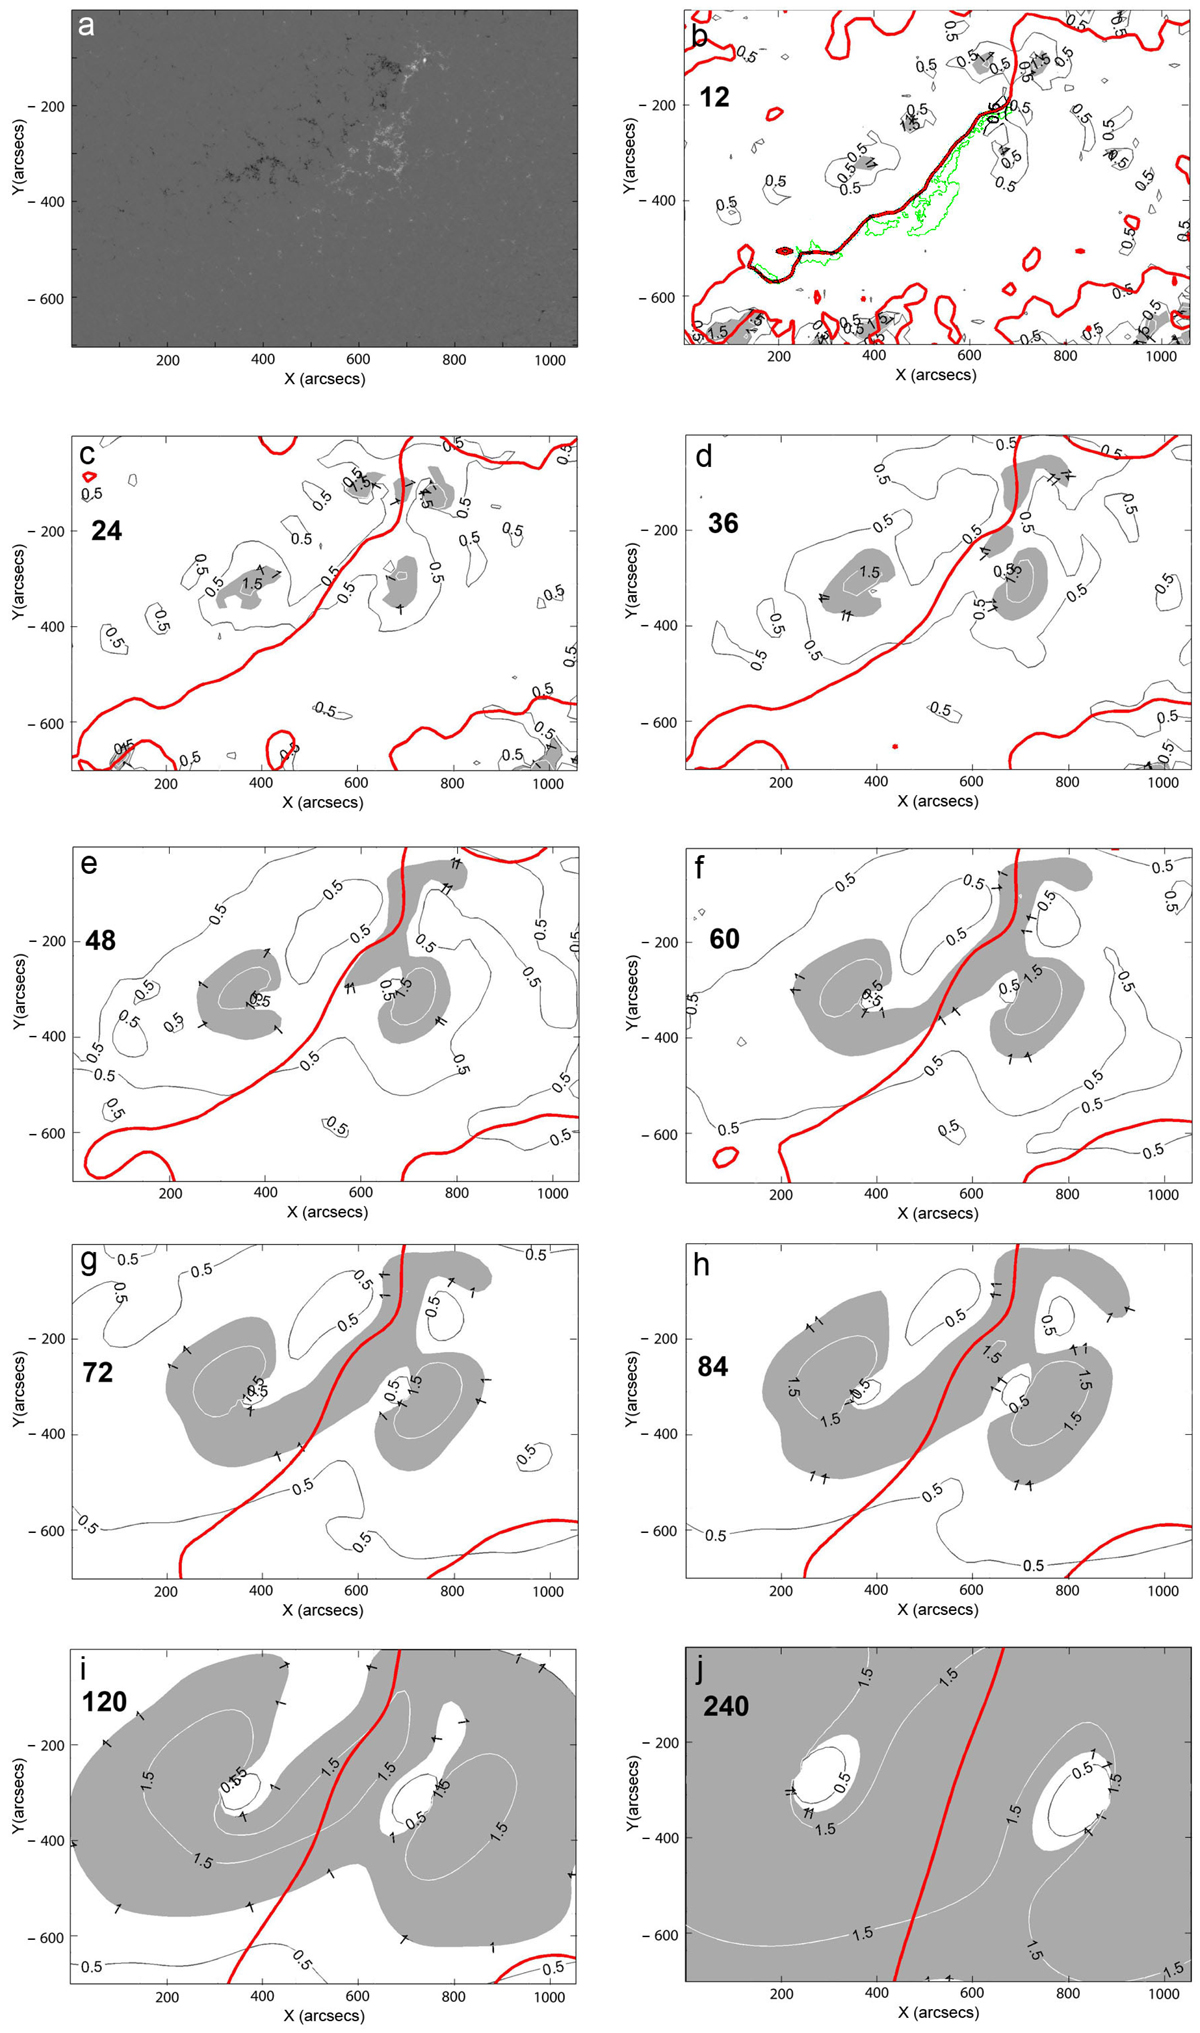
Panel a: HMI magnetogram of the selected area taken on January 26, 2016 at 16:30 UT. Panels b–j: distribution of the decay index n of the potential magnetic field at different heights above the area shown in first figure (panel a). Areas where n > 1 are tinted with gray, while regions with n < 1 are white. Red lines indicate the position of the polarity inversion lines (PIL). The green contour shows the position of the filament taken from the co-aligned BBSO Hα filtergram. The torus instability in the zone of the PIL occurs for decay-index values n > 1.
Current usage metrics show cumulative count of Article Views (full-text article views including HTML views, PDF and ePub downloads, according to the available data) and Abstracts Views on Vision4Press platform.
Data correspond to usage on the plateform after 2015. The current usage metrics is available 48-96 hours after online publication and is updated daily on week days.
Initial download of the metrics may take a while.