Fig. 6
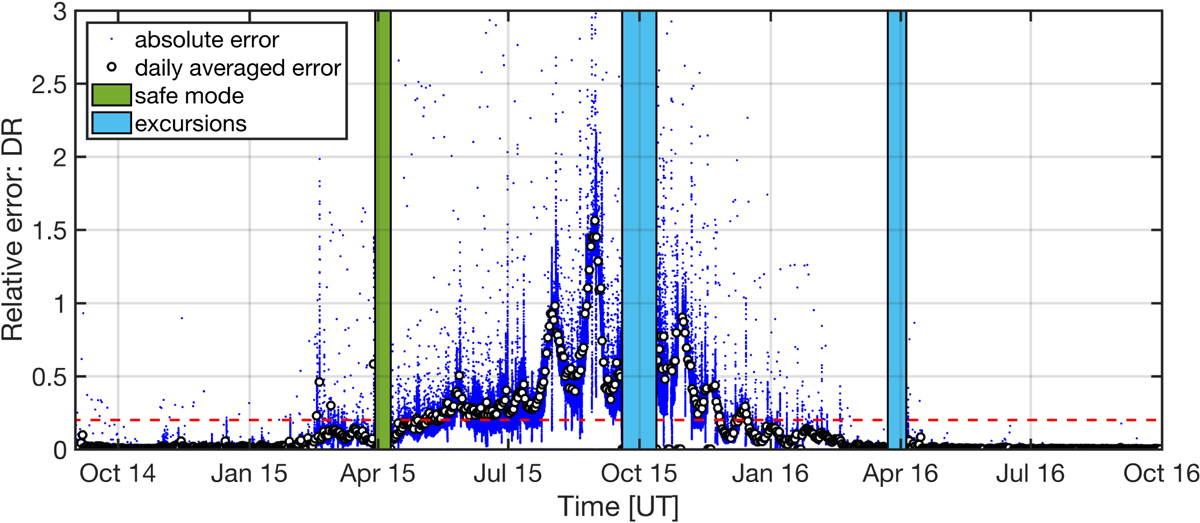
Relative error between implementing and neglecting electron–ion dissociative recombination (assuming Te = 200 K) on the ionospheric densities at the location of Rosetta during the escort phase. The blue dots correspond to the continuous error and the white dots to the daily averaged error. The red dashed line stands for the 20% error threshold.
Current usage metrics show cumulative count of Article Views (full-text article views including HTML views, PDF and ePub downloads, according to the available data) and Abstracts Views on Vision4Press platform.
Data correspond to usage on the plateform after 2015. The current usage metrics is available 48-96 hours after online publication and is updated daily on week days.
Initial download of the metrics may take a while.