Open Access
Fig. 14
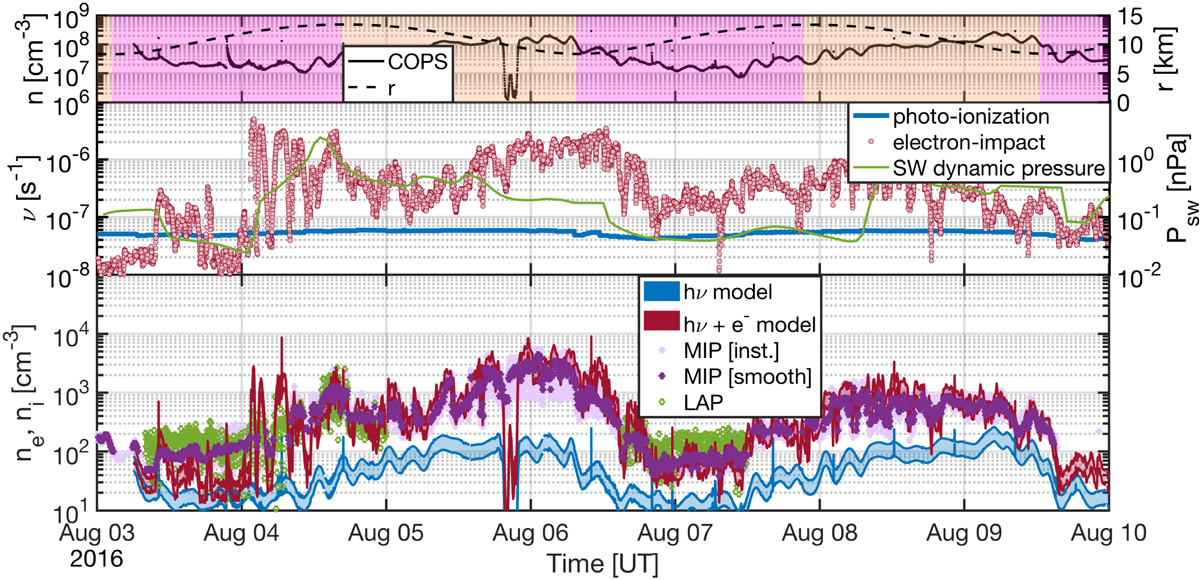
Same as Fig. 11 applied to 2016 August 3–10. The neutral outflow velocities are assumed to lie within 400–700 ms−1 in the ionospheric model. We have also plotted the solar wind dynamic pressure (green curve, middle panel) as predicted by the Tao et al. (2005) model to illustrate the effect of the CIR impact.
Current usage metrics show cumulative count of Article Views (full-text article views including HTML views, PDF and ePub downloads, according to the available data) and Abstracts Views on Vision4Press platform.
Data correspond to usage on the plateform after 2015. The current usage metrics is available 48-96 hours after online publication and is updated daily on week days.
Initial download of the metrics may take a while.