Fig. 11
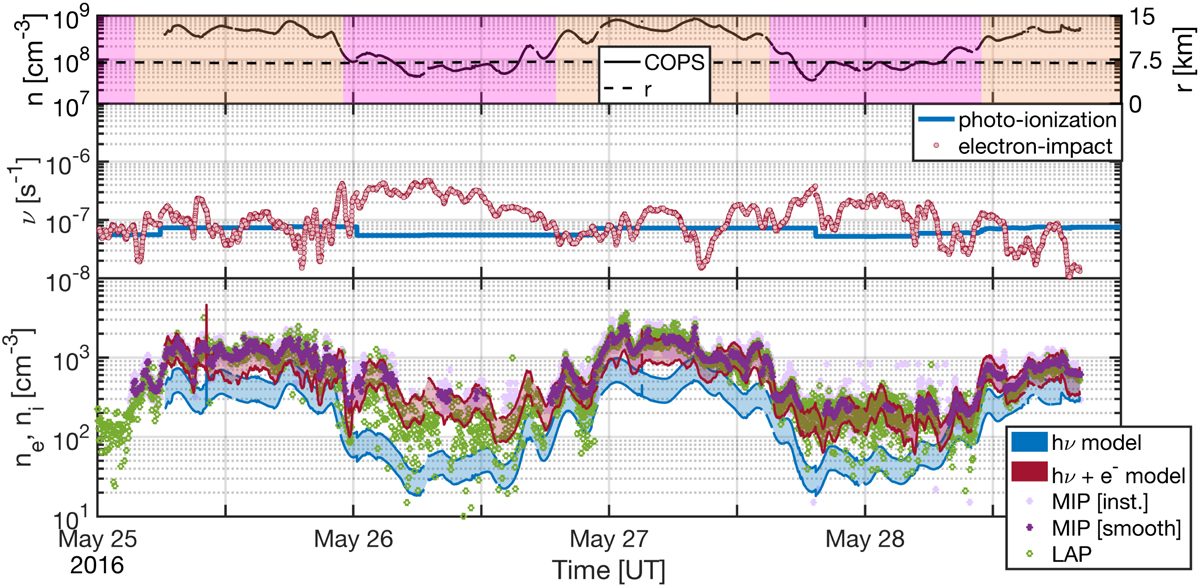
Top: time series of the ROSINA–COPS measured neutral number density (full line) and cometocentric distance of the spacecraft (dashed line). Middle: time series of the photo-ionization frequency νhν (blue curve), electron-impact ionization frequencies corrected with the spacecraft potential (red dots). Seasonal variations are colour coded in the top panel with pink for spring (northern hemisphere) and yellow for autumn (southern hemisphere). The ionization frequencies are weighted with respect to the local neutral composition measured by ROSINA–DFMS. Bottom: time series of the RPC–MIP measured electron number density (pink dots), smoothed using a 5-minute average (purple) and RPC–LAP derived total ion densities (green). Simplified modelled ionospheric densities (Eq. (9)) using photo-ionization only (blue) and both photo-ionization and electron-impact ionization (red), assuming outflow velocity from 300 ms−1 (upper bound) to 600 ms−1 (lower bound).
Current usage metrics show cumulative count of Article Views (full-text article views including HTML views, PDF and ePub downloads, according to the available data) and Abstracts Views on Vision4Press platform.
Data correspond to usage on the plateform after 2015. The current usage metrics is available 48-96 hours after online publication and is updated daily on week days.
Initial download of the metrics may take a while.