Fig. 10
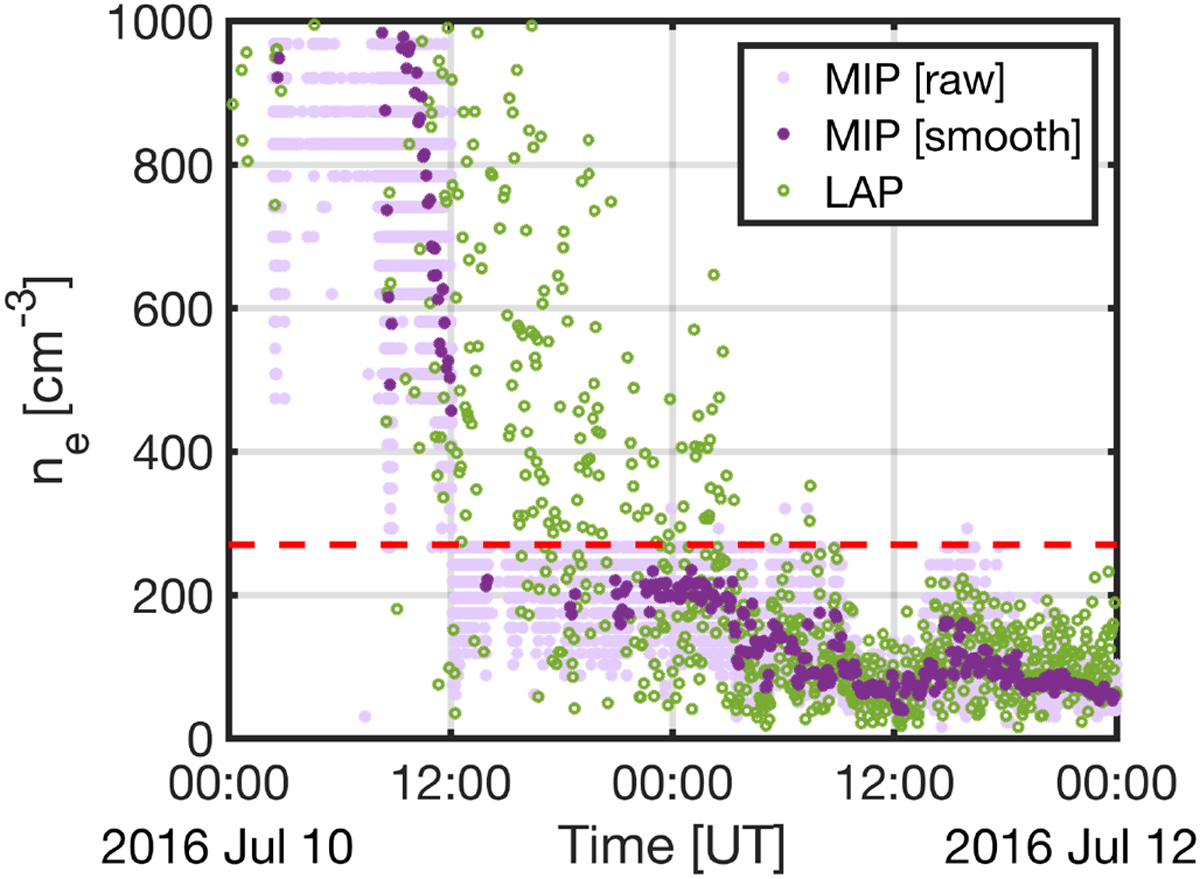
Time evolution of the electron densities measured by RPC–MIP and RPC–LAP from 2016 July 10–11. The pink dots correspond to the raw RPC–MIP measurements, the purple dots correspond to the adjusted 5-min moving averages of the RPC–MIP measurements (as described in Sect. 3.2), the green circles correspond to the RPC–LAP densities cross-calibrated with RPC–MIP, and the red dashed line corresponds to the upper threshold of RPC–MIP LDL mode.
Current usage metrics show cumulative count of Article Views (full-text article views including HTML views, PDF and ePub downloads, according to the available data) and Abstracts Views on Vision4Press platform.
Data correspond to usage on the plateform after 2015. The current usage metrics is available 48-96 hours after online publication and is updated daily on week days.
Initial download of the metrics may take a while.