Fig. 1
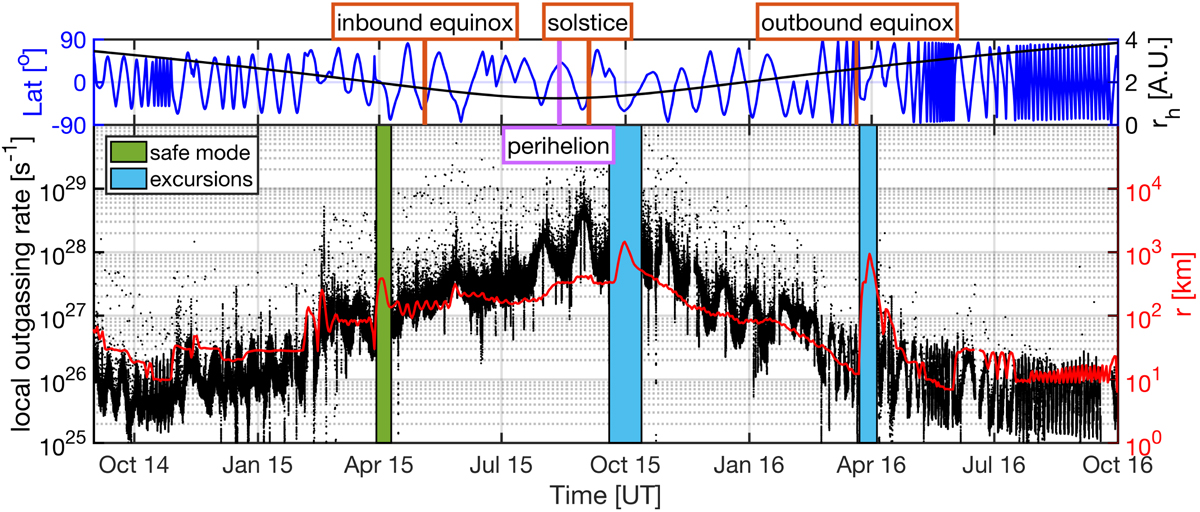
Top panel: time series of the spacecraft latitude (blue) and heliocentric distance (black). Bottom panel: time series of theestimated local outgassing rate (black) computed using a Haser model and an constant outflow velocity of 600 ms−1 together with the cometocentric distance (red). COPS data was unavailable during a safe mode (2015 April 1–10); bow shock (September–October 2015) and tail (March–April 2016) excursions have been removed.
Current usage metrics show cumulative count of Article Views (full-text article views including HTML views, PDF and ePub downloads, according to the available data) and Abstracts Views on Vision4Press platform.
Data correspond to usage on the plateform after 2015. The current usage metrics is available 48-96 hours after online publication and is updated daily on week days.
Initial download of the metrics may take a while.