Fig. 9
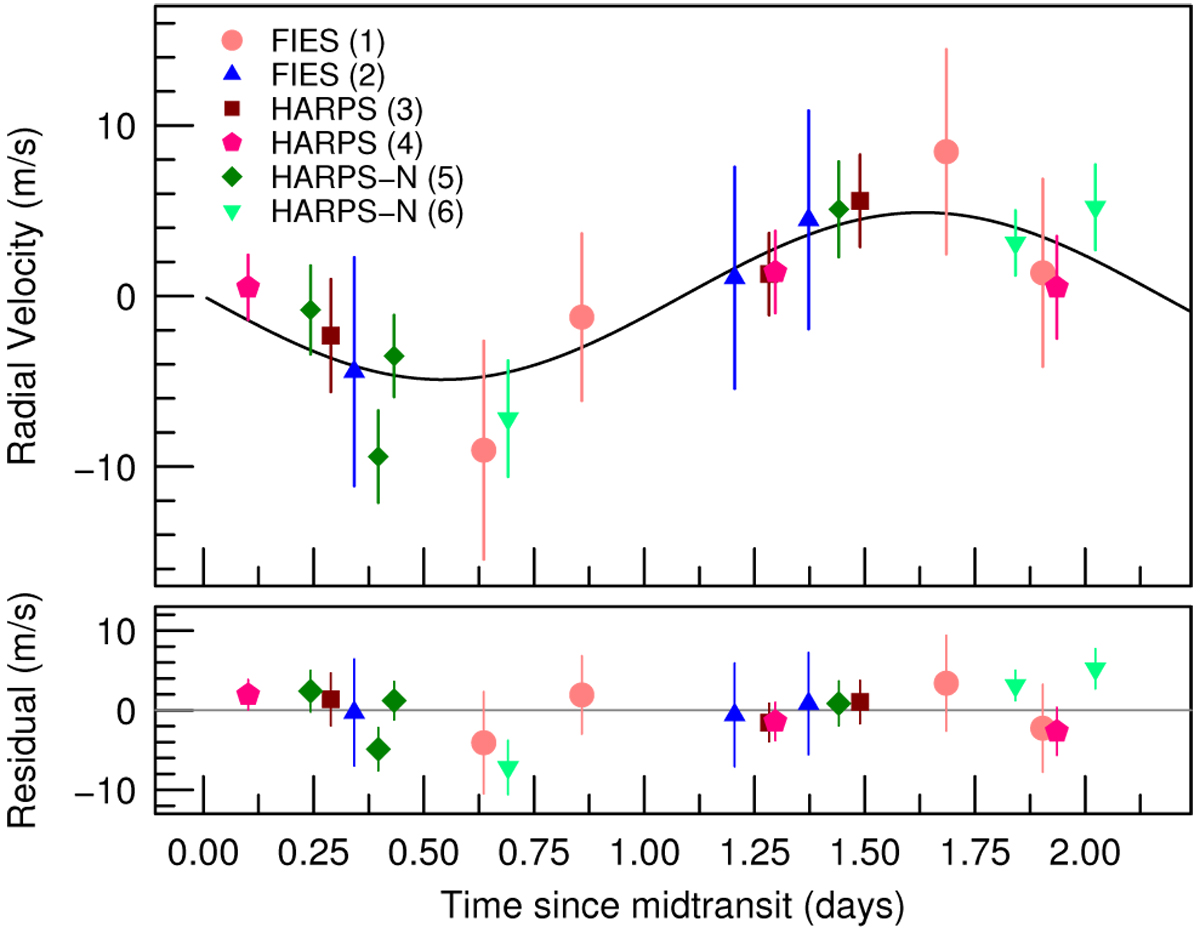
Radial velocity curve phase folded to the orbital period of the planet (2.17 days) using the FCO technique. The RV data from the different chunks from each spectrometer are indicated in a variety of colours and symbols. The double point used in both chunk three and four is plotted twice with a slight phase offset for clarity. Seven of the time isolated RVs have been removed from the fit. The resulting K amplitude is 5.0 ± 1.0 m s−1. The lower panel shows residuals of the fit.
Current usage metrics show cumulative count of Article Views (full-text article views including HTML views, PDF and ePub downloads, according to the available data) and Abstracts Views on Vision4Press platform.
Data correspond to usage on the plateform after 2015. The current usage metrics is available 48-96 hours after online publication and is updated daily on week days.
Initial download of the metrics may take a while.