Free Access
Fig. 8
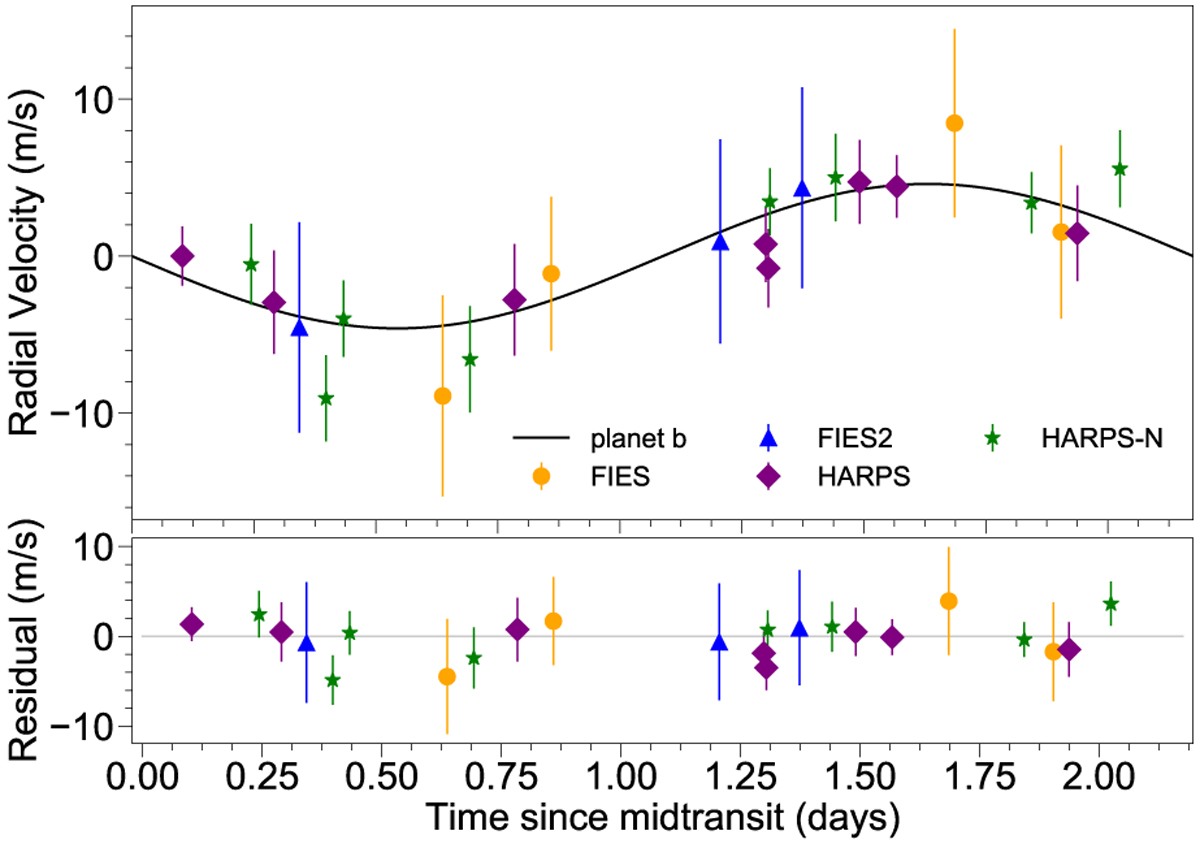
Radial velocity curve of K2-216 phase folded to the orbital period of the planet using the GP regression model. The data are plotted with the same colour code as in Fig. 7. The resulting
K amplitude is ![]() m s−1. The lower panel shows residuals of the fit.
m s−1. The lower panel shows residuals of the fit.
Current usage metrics show cumulative count of Article Views (full-text article views including HTML views, PDF and ePub downloads, according to the available data) and Abstracts Views on Vision4Press platform.
Data correspond to usage on the plateform after 2015. The current usage metrics is available 48-96 hours after online publication and is updated daily on week days.
Initial download of the metrics may take a while.