Fig. 7
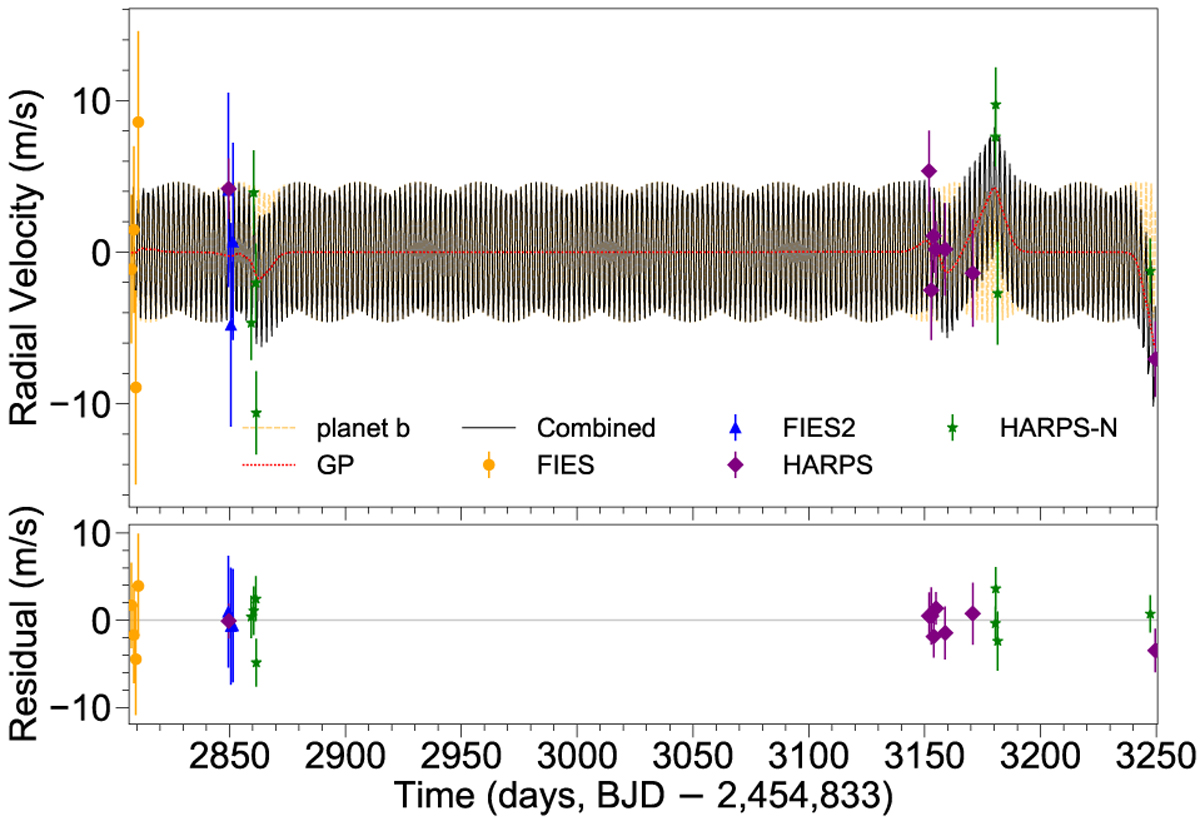
Measured RV variation of K2-216 from HARPS-N (green stars), HARPS (purple diamonds), FIES (yellow circles), and FIES2 (blue triangles). The black solid line is the best fit from the GP regression model of the correlated stellar noise and the signal from K2-216 b. The signal from planet b is shown by the yellow dashed line, and the GP regression model of correlated stellar noise by the red dotted line. The lower panel shows residuals of the fit.
Current usage metrics show cumulative count of Article Views (full-text article views including HTML views, PDF and ePub downloads, according to the available data) and Abstracts Views on Vision4Press platform.
Data correspond to usage on the plateform after 2015. The current usage metrics is available 48-96 hours after online publication and is updated daily on week days.
Initial download of the metrics may take a while.