Free Access
Fig. 3
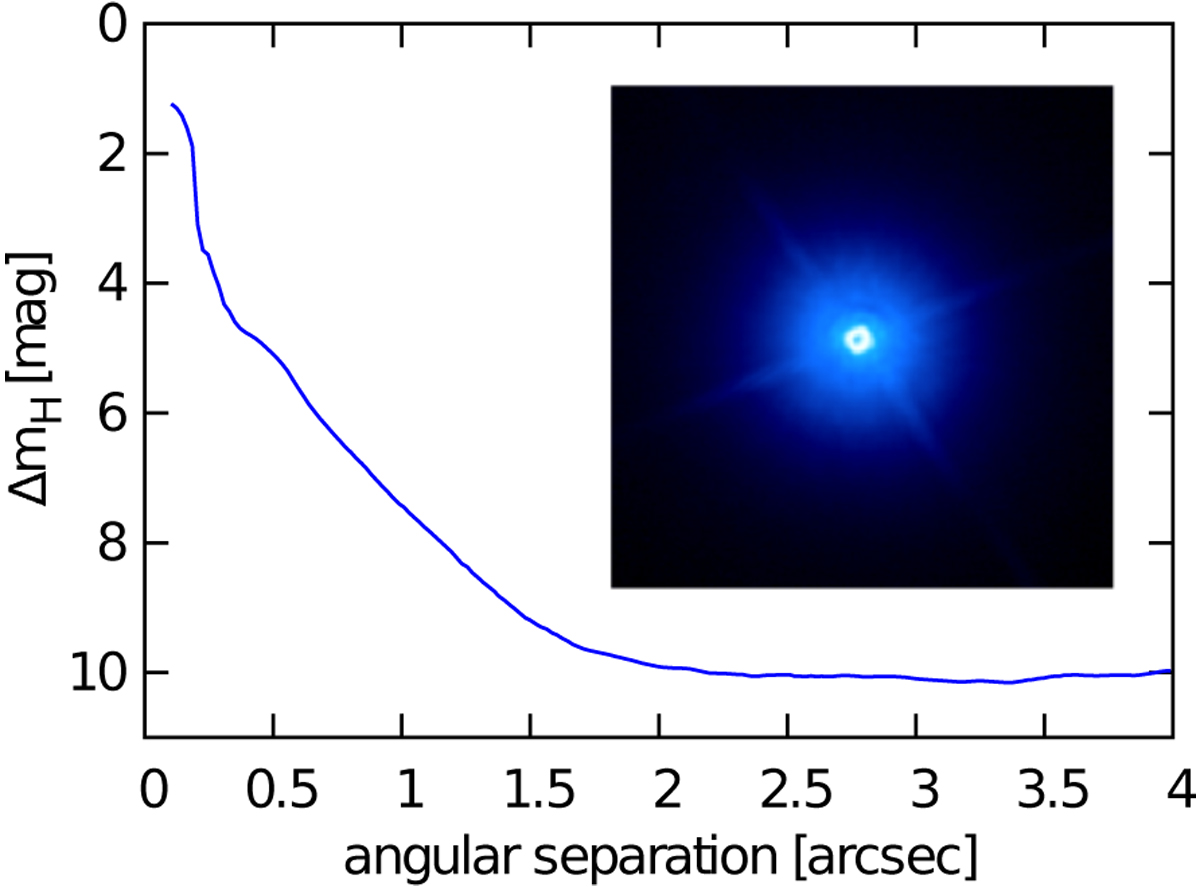
H-band (1630 nm) 5σ magnitude contrast curve as a function of angular separation from K2-216 obtained with IRCS/Subaru. The inset shows the 4′′ × 4′′ saturated image.
Current usage metrics show cumulative count of Article Views (full-text article views including HTML views, PDF and ePub downloads, according to the available data) and Abstracts Views on Vision4Press platform.
Data correspond to usage on the plateform after 2015. The current usage metrics is available 48-96 hours after online publication and is updated daily on week days.
Initial download of the metrics may take a while.