Fig. A.1
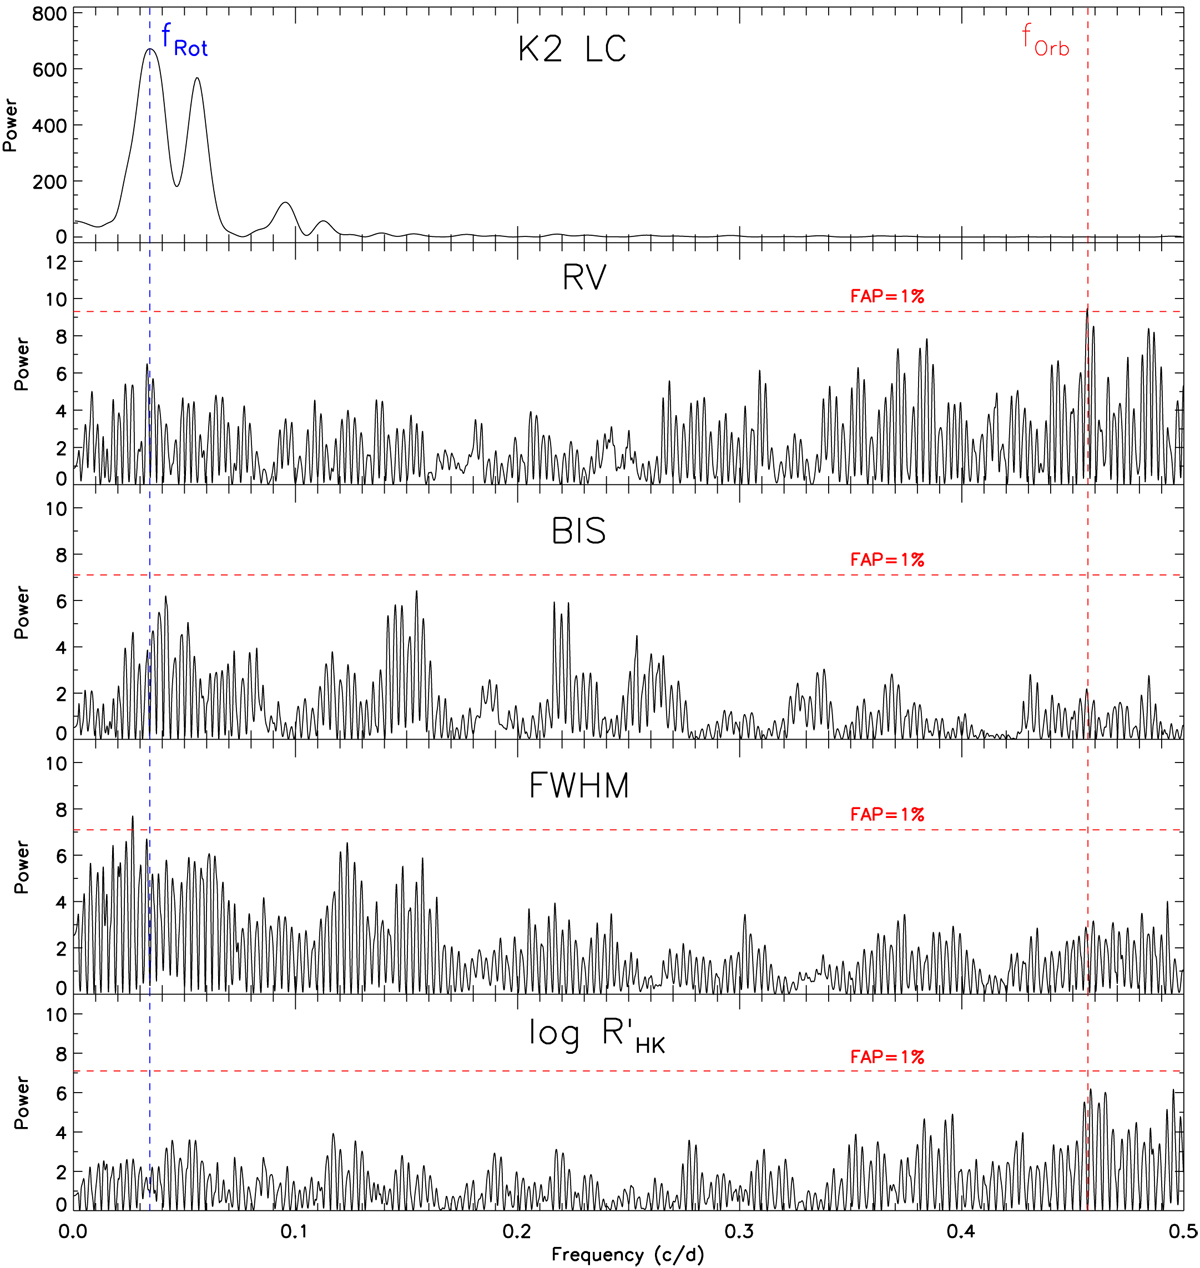
From top to bottom panels: generalised Lomb–Scargle periodograms of the K2 light curve, the RV measurements, BIS, FWFM of the correlation function, and the activity index![]() where the last four are extracted from the FIES, HARPS, and HARPS-N data. The stellar period is indicated with the vertical dashed blue line, and the planet orbital period with the vertical dashed red line. The false-alarm probability (FAP) is indicated at the 1% level.
where the last four are extracted from the FIES, HARPS, and HARPS-N data. The stellar period is indicated with the vertical dashed blue line, and the planet orbital period with the vertical dashed red line. The false-alarm probability (FAP) is indicated at the 1% level.
Current usage metrics show cumulative count of Article Views (full-text article views including HTML views, PDF and ePub downloads, according to the available data) and Abstracts Views on Vision4Press platform.
Data correspond to usage on the plateform after 2015. The current usage metrics is available 48-96 hours after online publication and is updated daily on week days.
Initial download of the metrics may take a while.