Fig. 10
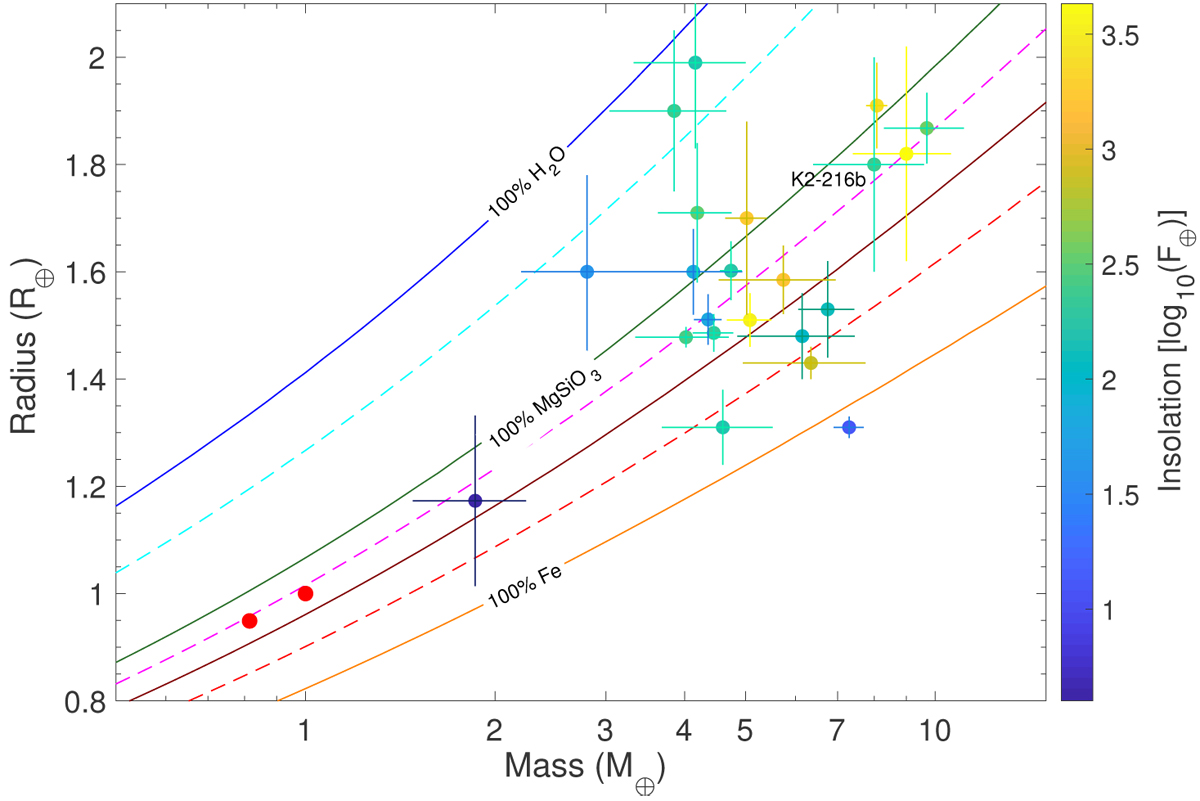
Mass-radius diagram of all small exoplanets (Rp ≤ 2 R⊕ and Mp ≤ 30 M⊕) with a measured mass and radius to a precision better than 20% as listed in the NASA Exoplanet Archive. The colours of the planets indicate the insolation in units of log 10 (F⊕). Earth and Venus are plotted in red filled circles for comparison. The solid lines are theoretical mass-radius curves (Zeng et al. 2016); from top to bottom: 100% H2O (blue solid line), a mixture of 50% H2O and 50% MgSiO3 (cyan dashed line), 100% MgSiO3 (green solid line), a mixture of 75% MgSiO3 and 25% Fe (magenta dashed line), a mixture of 50% MgSiO3 and 50% Fe (brown solid line), a mixture of 25% MgSiO3 and 75% Fe(red dashed line), and 100% Fe (orange solid line).
Current usage metrics show cumulative count of Article Views (full-text article views including HTML views, PDF and ePub downloads, according to the available data) and Abstracts Views on Vision4Press platform.
Data correspond to usage on the plateform after 2015. The current usage metrics is available 48-96 hours after online publication and is updated daily on week days.
Initial download of the metrics may take a while.