Fig. A.1.
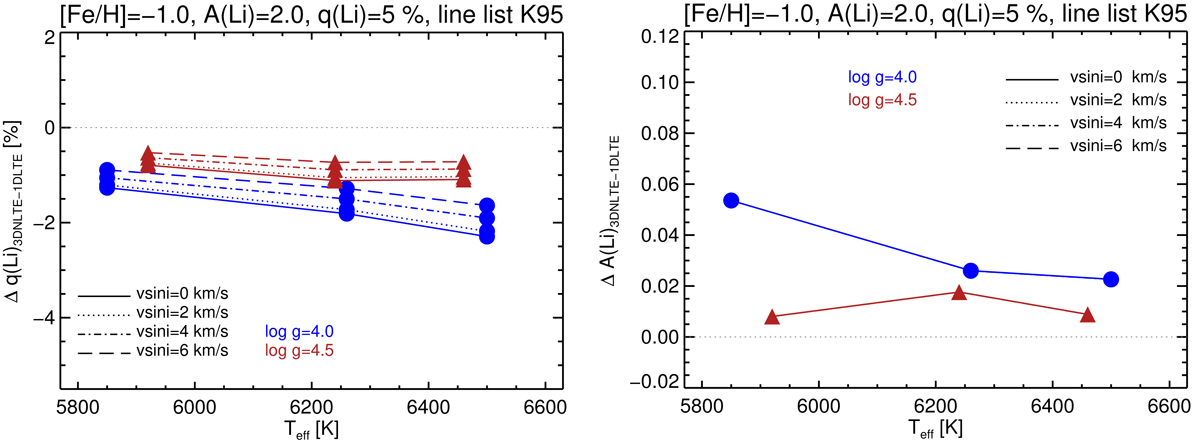
3D NLTE corrections for 6Li/7Li (left panel) and A(Li) (right panel) vs. Teff for [Fe/H] = −1.0, A(Li) = 2.0, q(Li) = 5%, derived with line list K95. The blue circles and the red triangles correspond to log ℊ = 4.0 and log ℊ = 4.5, respectively. The corrections for different υ sin i values are connected with lines of different styles.
Current usage metrics show cumulative count of Article Views (full-text article views including HTML views, PDF and ePub downloads, according to the available data) and Abstracts Views on Vision4Press platform.
Data correspond to usage on the plateform after 2015. The current usage metrics is available 48-96 hours after online publication and is updated daily on week days.
Initial download of the metrics may take a while.