Fig. 8.
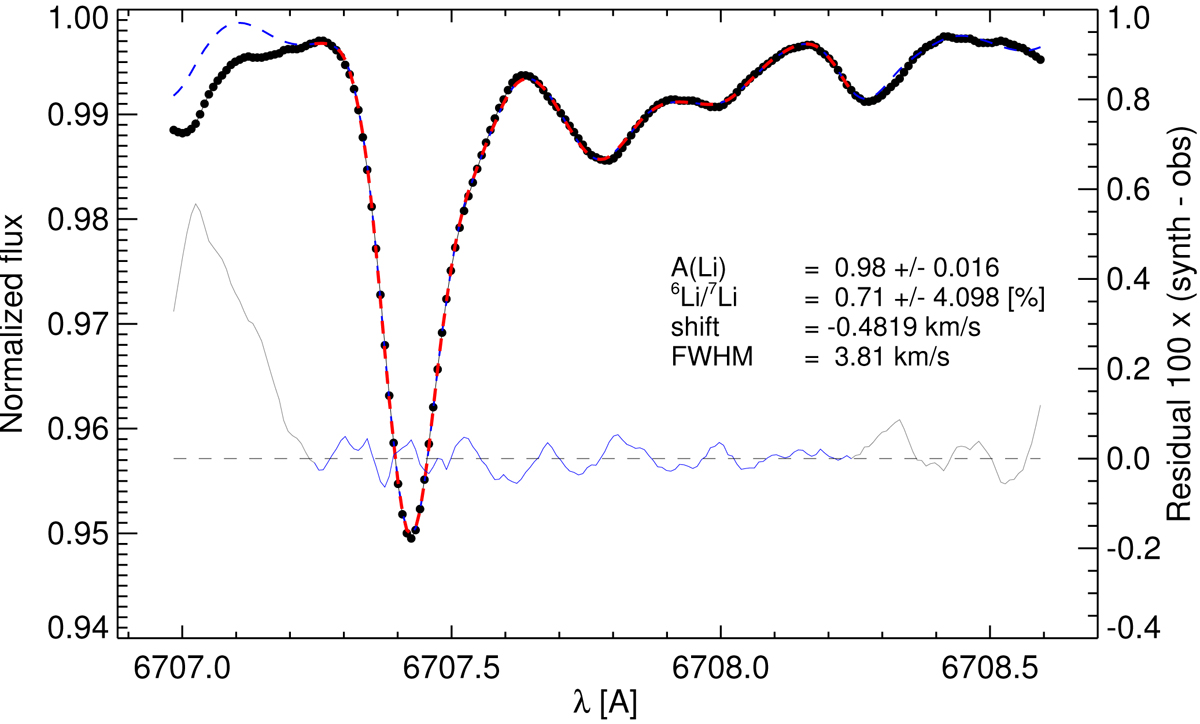
The best fitting 1D LTE ATLAS/MOOG spectrum (dashed line) superimposed on the solar flux atlas spectrum of Kurucz (2005; black dots), fixing the continuum level at 0.9977 (relative to the continuum placement of the flux atlas), and using line list G09 (with modifications described in Sect. 3.3) and slight adjustments in the strengths of the CN, Fe, Si, and V lines (see Case C, Table 6) The right y-axis defines the scale of the residuals (thin blue line).
Current usage metrics show cumulative count of Article Views (full-text article views including HTML views, PDF and ePub downloads, according to the available data) and Abstracts Views on Vision4Press platform.
Data correspond to usage on the plateform after 2015. The current usage metrics is available 48-96 hours after online publication and is updated daily on week days.
Initial download of the metrics may take a while.