Fig. 6.
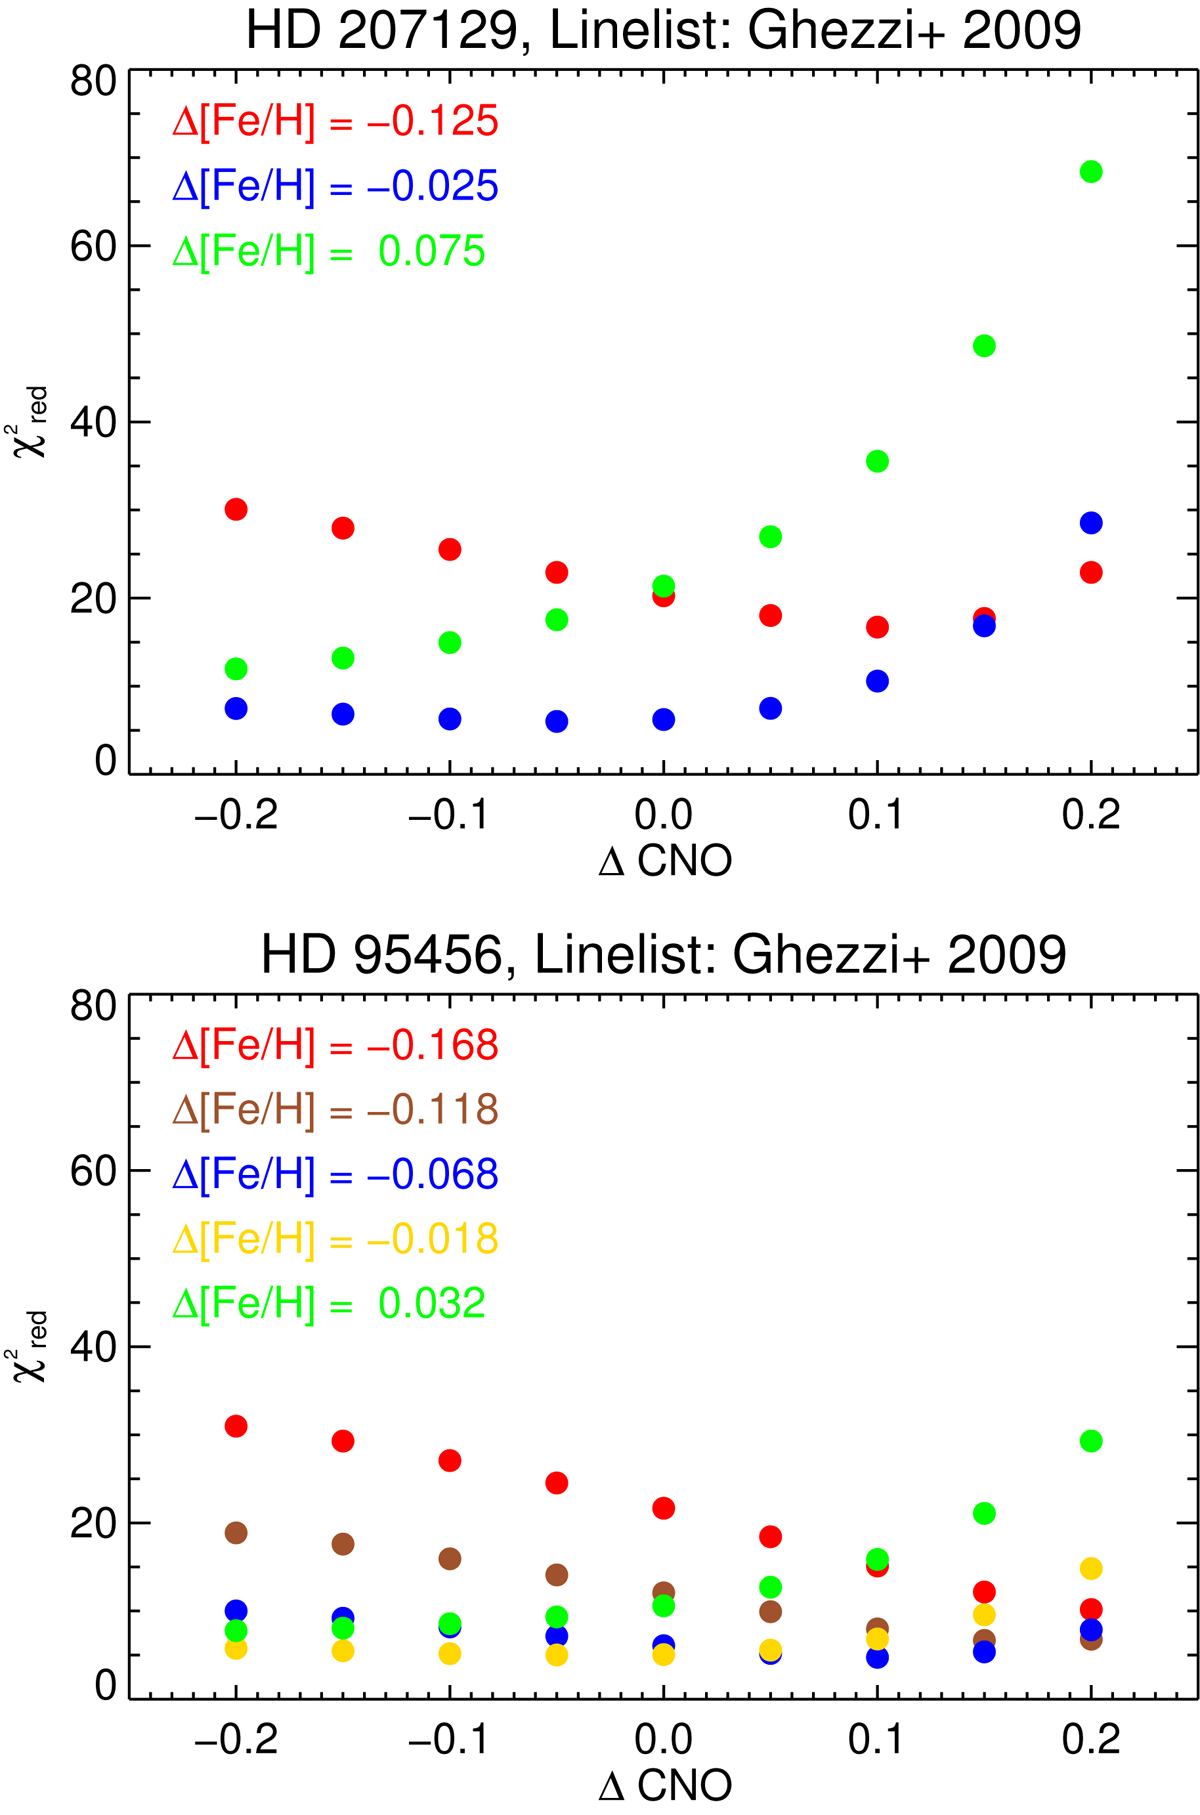
The best ![]() obtained by fitting the HARPS spectra of HD 207129 (upper panel) and HD 95456 (lower panel) with grids of 1D LTE line profiles computed for combinations of different Fe and CNO abundances. The line list G09 is adopted after some modifications described in Sect. 3.3. For each point, the minimum
obtained by fitting the HARPS spectra of HD 207129 (upper panel) and HD 95456 (lower panel) with grids of 1D LTE line profiles computed for combinations of different Fe and CNO abundances. The line list G09 is adopted after some modifications described in Sect. 3.3. For each point, the minimum ![]() is obtained by optimizing A(Li) and 6Li/7Li at given [Fe/H] and CNO abundance.
is obtained by optimizing A(Li) and 6Li/7Li at given [Fe/H] and CNO abundance.
Current usage metrics show cumulative count of Article Views (full-text article views including HTML views, PDF and ePub downloads, according to the available data) and Abstracts Views on Vision4Press platform.
Data correspond to usage on the plateform after 2015. The current usage metrics is available 48-96 hours after online publication and is updated daily on week days.
Initial download of the metrics may take a while.