Fig. 5.
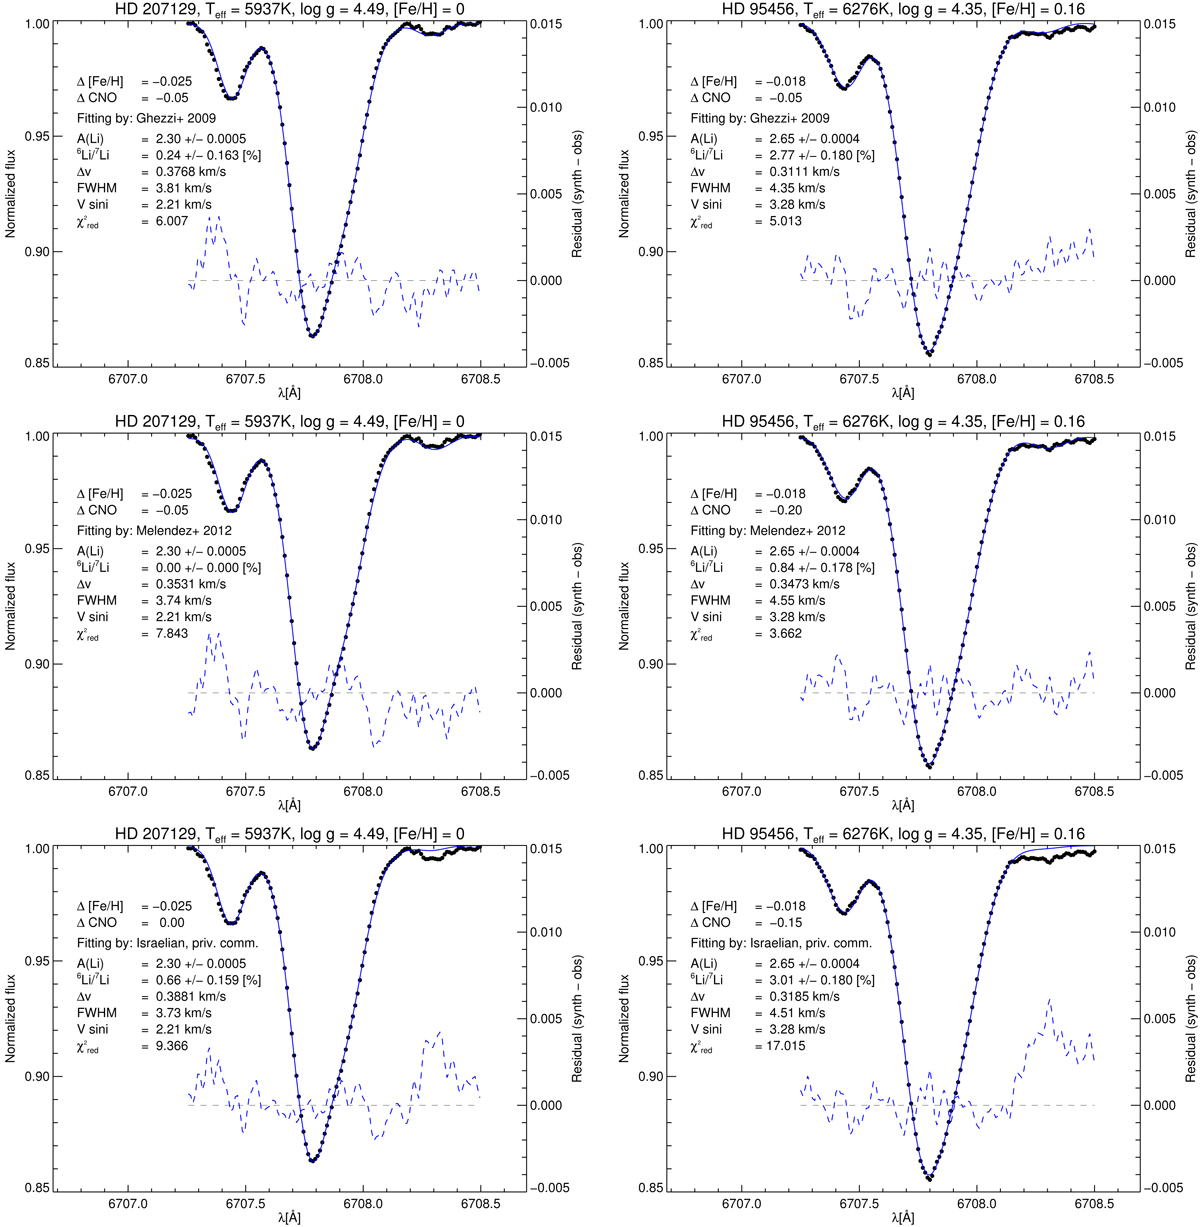
The best fitting 1D LTE spectrum (solid line) superimposed on the HARPS spectrum (dots) for HD 207129 (left panels) and HD 95456 (right panels). The synthetic line profiles are computed adopting the line lists G09, M12, and I14 (from top to bottom), with modifications described in Sect. 3.3. The right y-axis defines the scale of the residuals (dashed line).
Current usage metrics show cumulative count of Article Views (full-text article views including HTML views, PDF and ePub downloads, according to the available data) and Abstracts Views on Vision4Press platform.
Data correspond to usage on the plateform after 2015. The current usage metrics is available 48-96 hours after online publication and is updated daily on week days.
Initial download of the metrics may take a while.