Fig. 4.
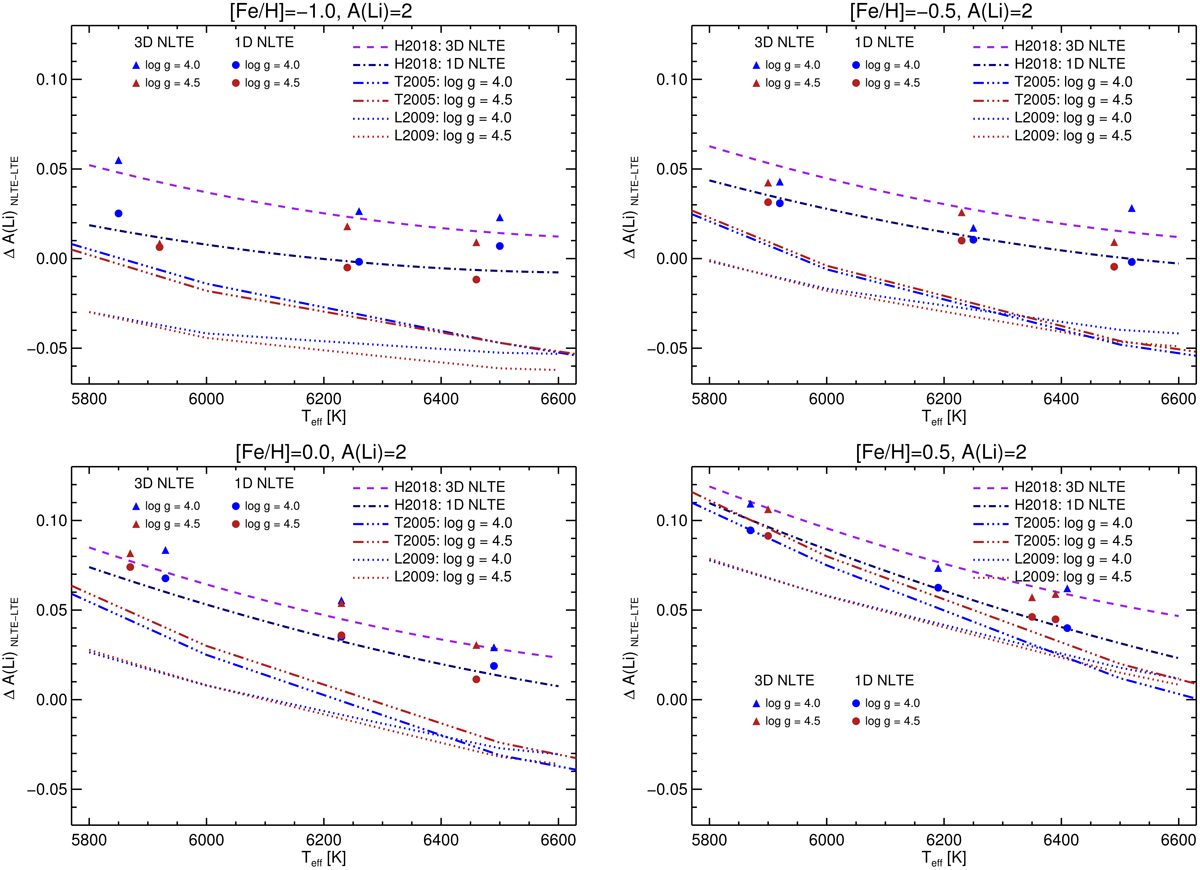
Comparison of the 1D and 3D NLTE abundance corrections derived in this work with the 1D NLTE corrections from Lind et al. (2009; L2009, dotted lines) and Takeda & Kawanomoto (2005; T2005, dash-dotted lines) for metallicities −1.0, −0.5, 0.0, and +0.5 (from top left to bottom right). Red and blue triangles denote the individual 3D NLTE corrections, while red and blue circles denote the individual 1D NLTE corrections for A(Li) computed in this work (H2018) for log ℊ of 4.0 and 4.5, respectively.
Current usage metrics show cumulative count of Article Views (full-text article views including HTML views, PDF and ePub downloads, according to the available data) and Abstracts Views on Vision4Press platform.
Data correspond to usage on the plateform after 2015. The current usage metrics is available 48-96 hours after online publication and is updated daily on week days.
Initial download of the metrics may take a while.