Fig. C.2.
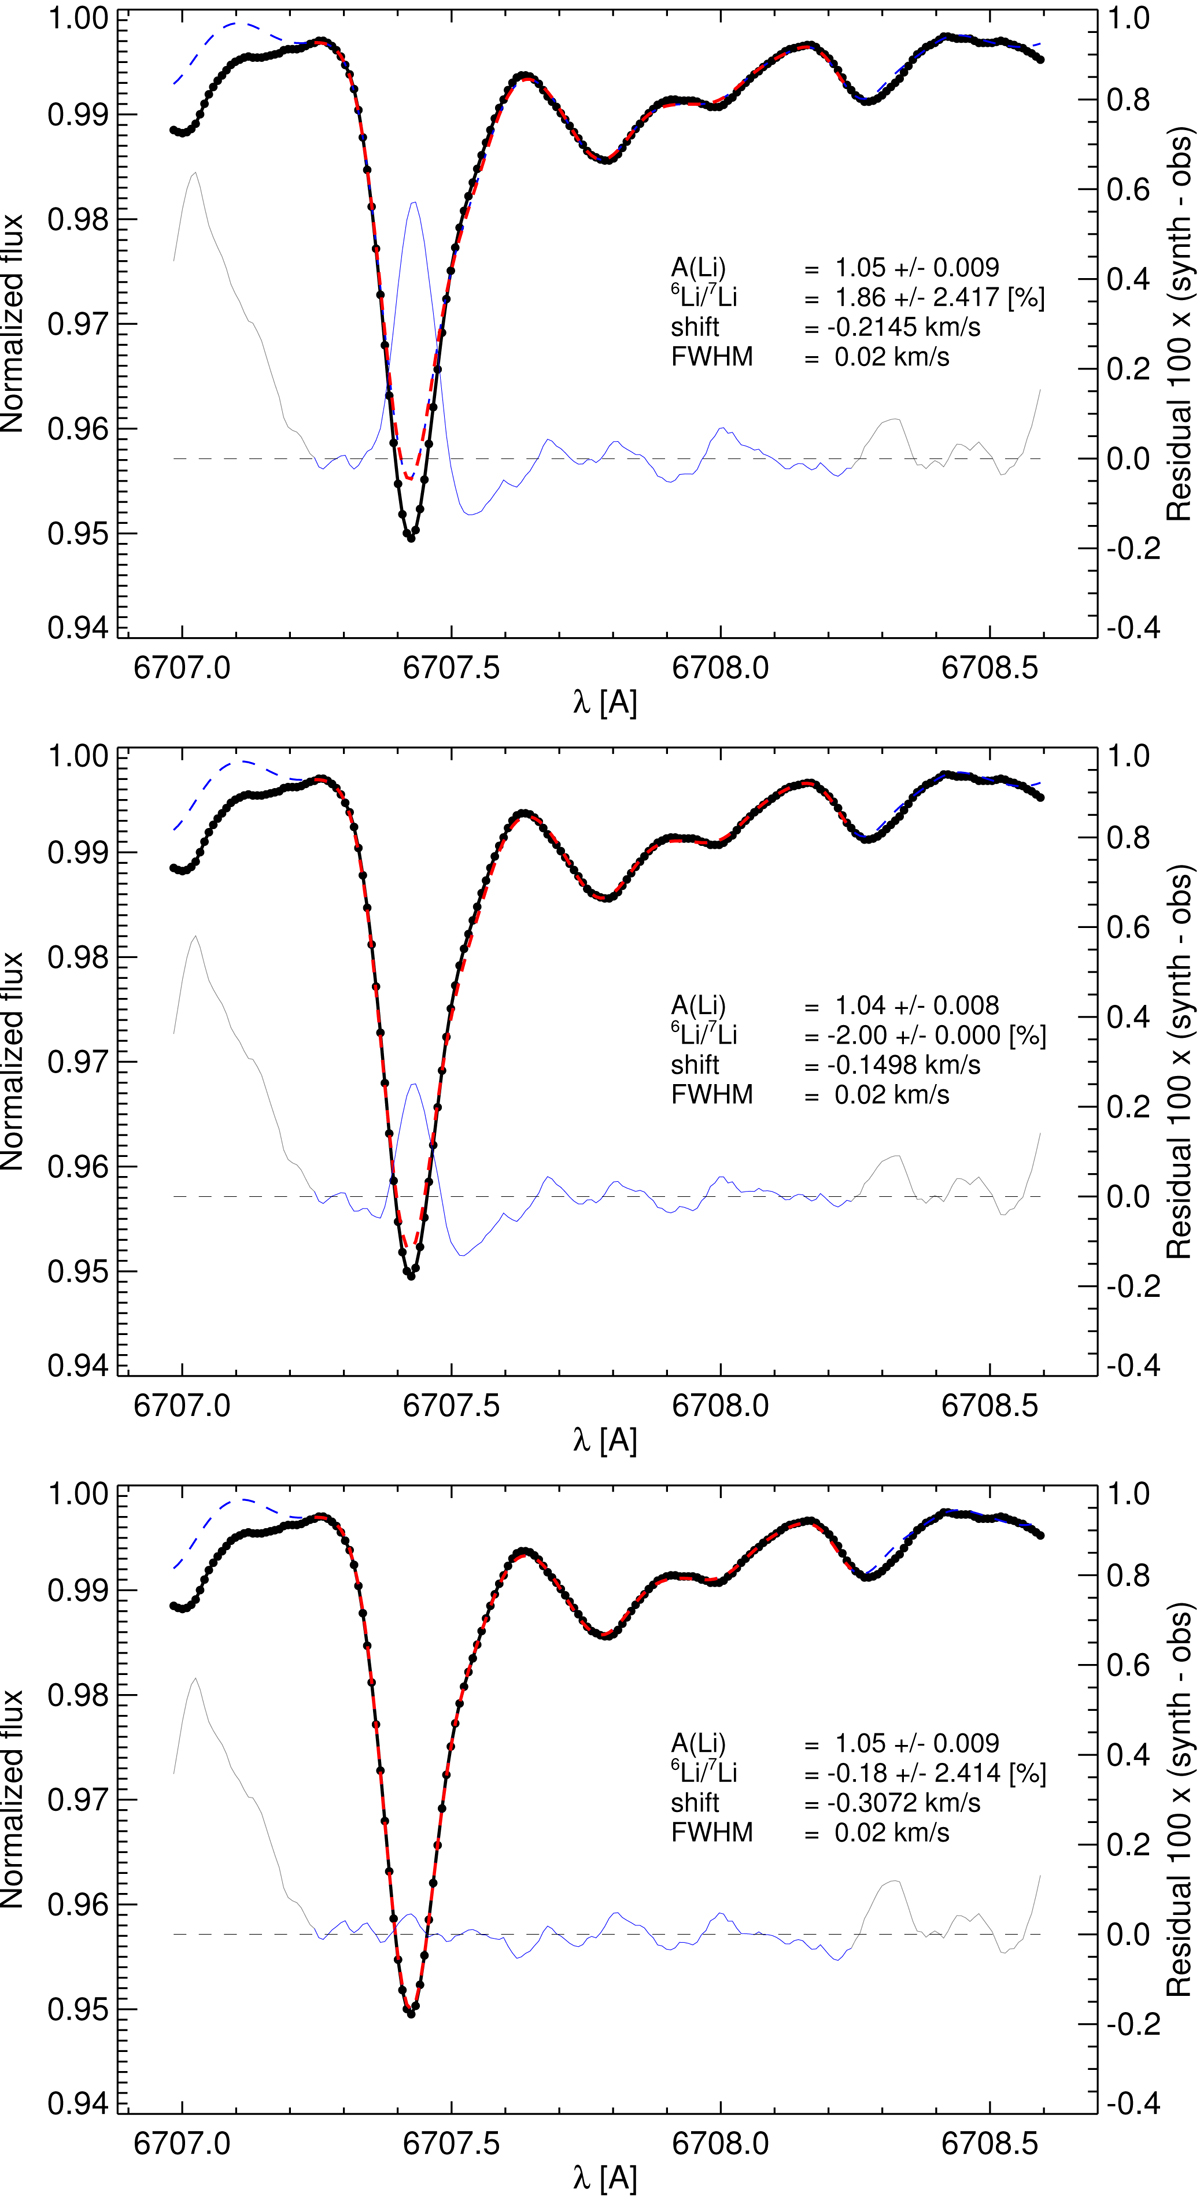
Best fits of the solar flux spectrum of Kurucz (2005; black dots) with different sets of 3D NLTE CO5BOLD spectra (red dashed line), adopting the same continuum level as in Fig. C.1. From top to bottom: Cases IIa, IIb, and IIc are all based on line list G09, but assume different chemical abundances and rest wavelengths of the blend lines (see text and Table C.1 for details). The right y-axis defines the scale of the residuals (thin blue line).
Current usage metrics show cumulative count of Article Views (full-text article views including HTML views, PDF and ePub downloads, according to the available data) and Abstracts Views on Vision4Press platform.
Data correspond to usage on the plateform after 2015. The current usage metrics is available 48-96 hours after online publication and is updated daily on week days.
Initial download of the metrics may take a while.