Fig. B.1.
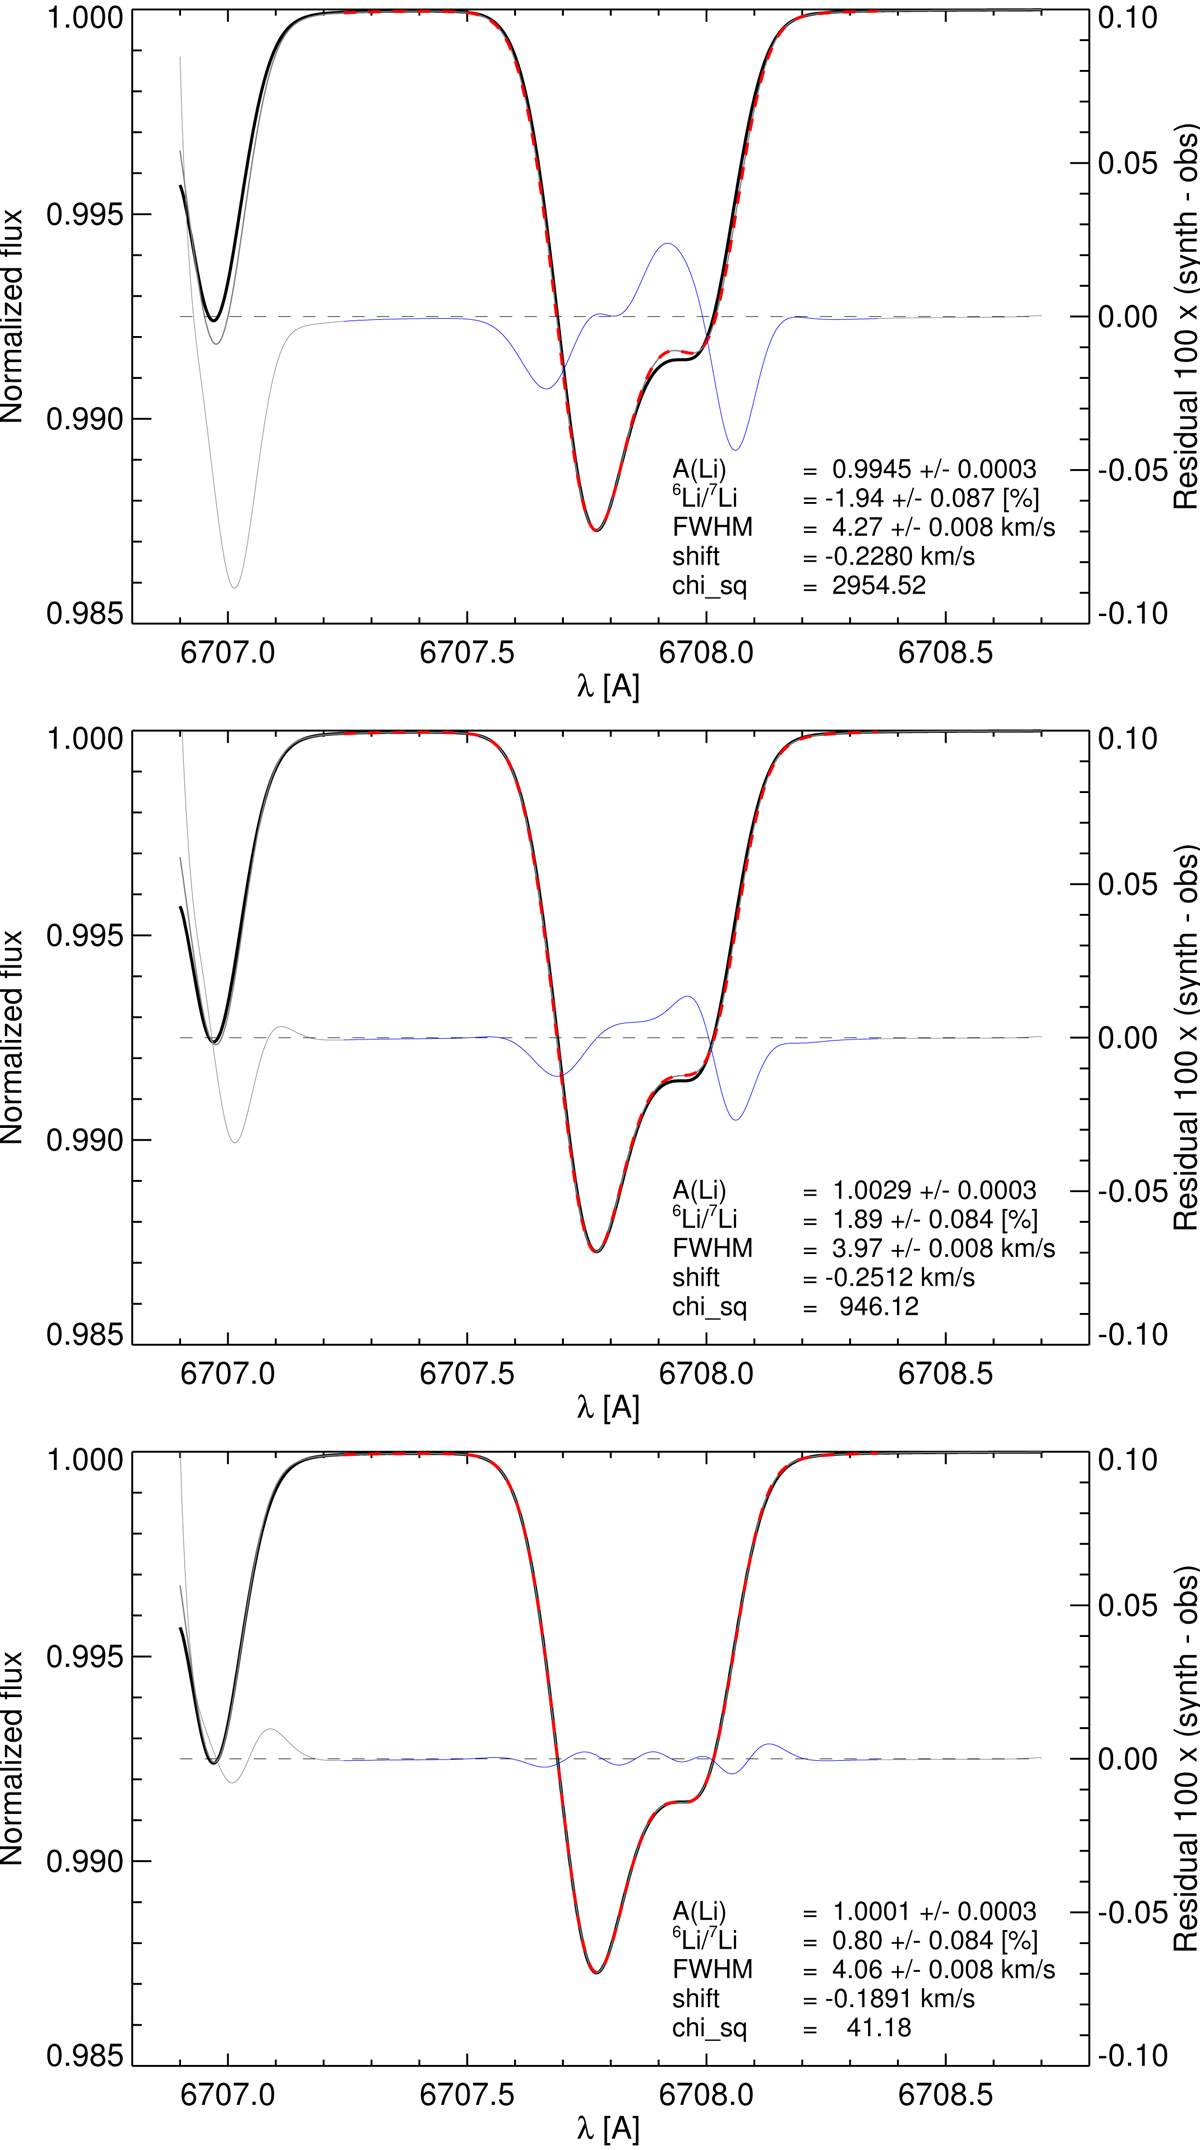
Best 1D fits (dashed line) to the 3D composite 7Li (NLTE) + Si (LTE) synthetic solar line profile (black solid line) achieved with different grids of 1D LTE 6Li + 7Li+Si profiles. From top to bottom: cases 2a, 2b, and 2c (see text and Table B.1 for details). The right y-axis defines the scale of the residuals (thin blue line).
Current usage metrics show cumulative count of Article Views (full-text article views including HTML views, PDF and ePub downloads, according to the available data) and Abstracts Views on Vision4Press platform.
Data correspond to usage on the plateform after 2015. The current usage metrics is available 48-96 hours after online publication and is updated daily on week days.
Initial download of the metrics may take a while.