Fig. 1.
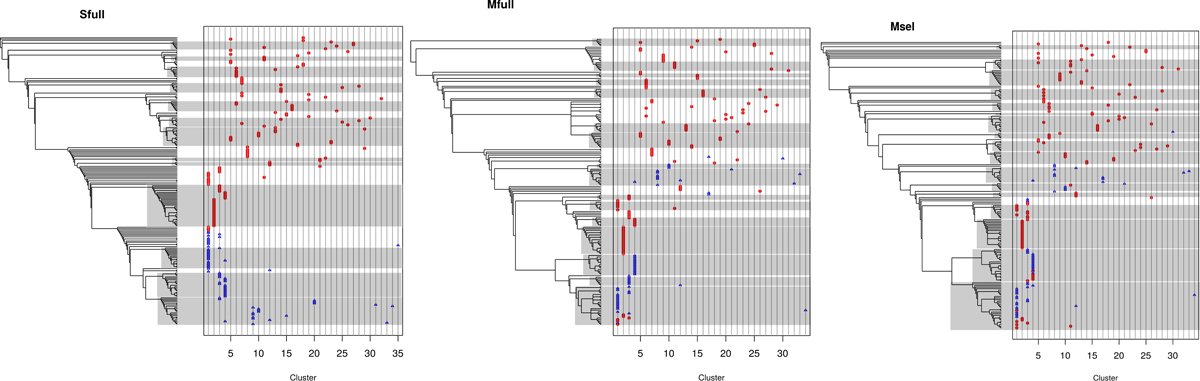
Cladograms obtained for 207 stars from 34 clusters calibrated using the Sun and with abundances from 25 elements (left panel), for 180 stars from 33 clusters calibrated using M 67 with abundances from 29 elements (middle panel) and with abundances from 8 elements (right panel). Red points and blue triangles correspond to red giant and dwarf stars, respectively. The horizontal axis gives the stellar cluster index, as given in Table 1, in decreasing order of the number of stars. The gray boxes indicate the structures on the tree that could be defined as groups. They also serve as a visual aid: the more the stars are stacked together vertically and the better they belong to the same gray box, the better is the phylogenetic reconstruction of the stellar clusters.
Current usage metrics show cumulative count of Article Views (full-text article views including HTML views, PDF and ePub downloads, according to the available data) and Abstracts Views on Vision4Press platform.
Data correspond to usage on the plateform after 2015. The current usage metrics is available 48-96 hours after online publication and is updated daily on week days.
Initial download of the metrics may take a while.