Fig. 4.
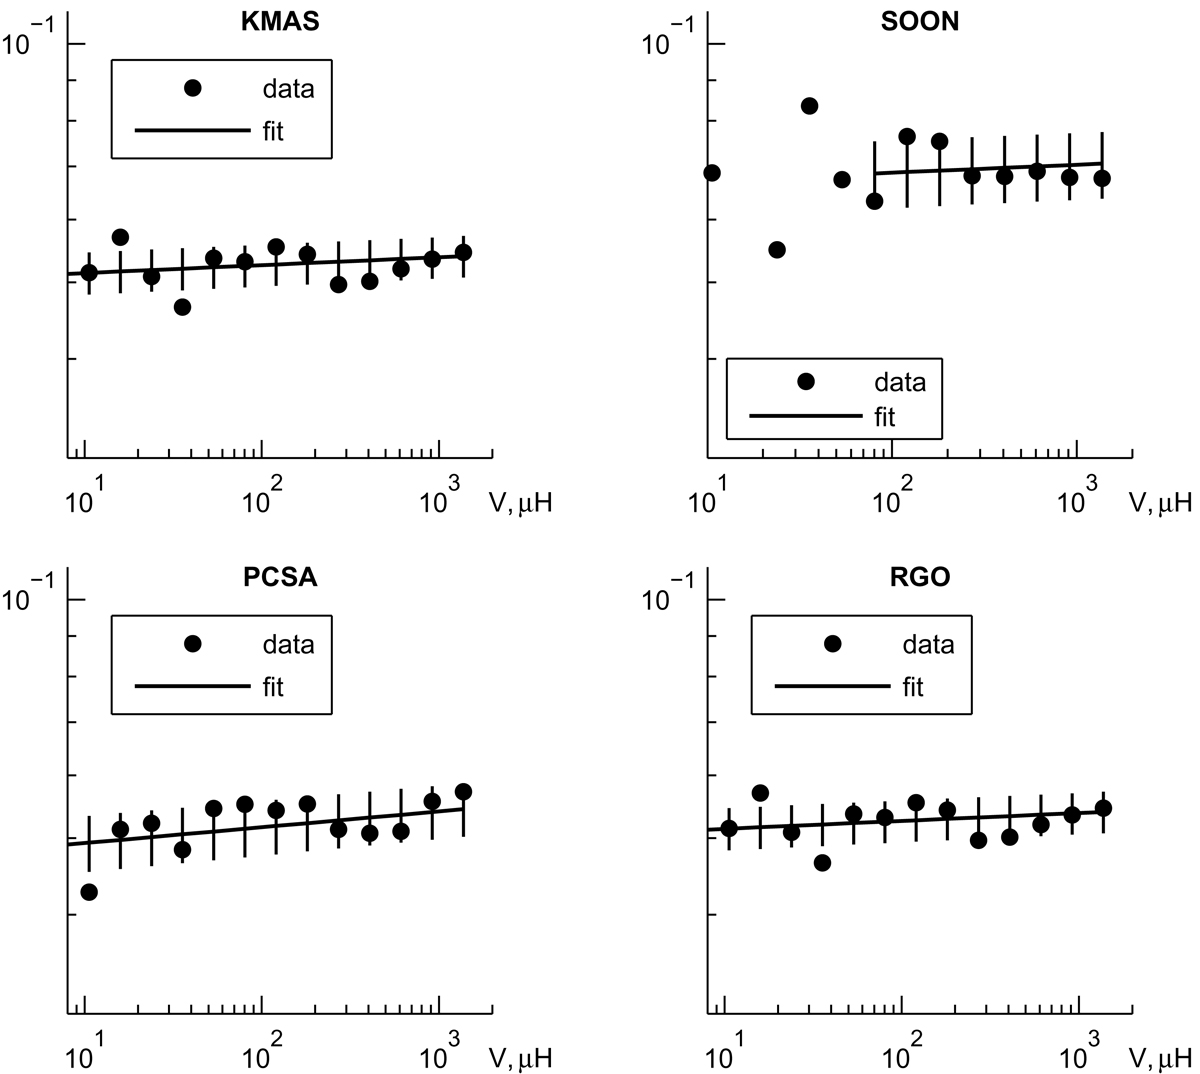
Segments of the size-frequency relations for catalogs RGO, SOON, PCSA, KMAS: ipf φ1 (circles) are shown together with theoretical values calculated for the power law distribution on the interval [a,b], where [a,b] is [10, 1000], [100, 1000], [10, 1000], [10, 1000] for RGO, SOON, PCSA, and KMAS respectively and with 0.95-confidence intervals illustrated by vertical lines; c2 = 1.5. V is measured in μH.
Current usage metrics show cumulative count of Article Views (full-text article views including HTML views, PDF and ePub downloads, according to the available data) and Abstracts Views on Vision4Press platform.
Data correspond to usage on the plateform after 2015. The current usage metrics is available 48-96 hours after online publication and is updated daily on week days.
Initial download of the metrics may take a while.