| Issue |
A&A
Volume 618, October 2018
|
|
|---|---|---|
| Article Number | A110 | |
| Number of page(s) | 13 | |
| Section | Stellar structure and evolution | |
| DOI | https://doi.org/10.1051/0004-6361/201832722 | |
| Published online | 19 October 2018 | |
Infrared nebulae around bright massive stars as indicators for binary interactions⋆
1
Instituut voor Sterrenkunde, KU Leuven, Celestijnenlaan 200D, Bus 2401, 3001 Leuven, Belgium
e-mail: julia.bodensteiner@kuleuven.be
2
Technische Universität München, James-Franck-Straße 1, 85748 Garching, Germany
3
Max-Planck-Institut für extraterrestrische Physik, Gießenbachstraße, 85748 Garching, Germany
4
European Southern Observatory, Karl-Schwarzschild-Straße 2, 85748 Garching, Germany
5
Argelander-Institut für Astronomie der Universität Bonn, Auf dem Hügel 71, 53121 Bonn, Germany
Received:
29
January
2018
Accepted:
20
May
2018
Context. Recent studies show that more than 70% of massive stars do not evolve as effectively single stars, but as members of interacting binary systems. The evolution of these stars is thus strongly altered compared to similar but isolated objects.
Aims. We investigate the occurrence of parsec-scale mid-infrared nebulae around early-type stars. If they exist over a wide range of stellar properties, one possible overarching explanation is non-conservative mass transfer in binary interactions, or stellar mergers.
Methods. For ∼3850 stars (all OBA stars in the Bright Star Catalogue (BSC), Be stars, BeXRBs, and Be+sdO systems), we visually inspect WISE 22 μm images. Based on nebular shape and relative position, we distinguish five categories: offset bow shocks structurally aligned with the stellar space velocity, unaligned offset bow shocks, and centered, unresolved, and not classified nebulae.
Results. In the BSC, we find that 28%, 13%, and 0.4% of all O, B, and A stars, respectively, possess associated infrared (IR) nebulae. Additionally, 34/234 Be stars, 4/72 BeXRBs, and 3/17 Be+sdO systems are associated with IR nebulae.
Conclusions. Aligned or unaligned bow shocks result from high relative velocities between star and interstellar medium (ISM) that are dominated by the star or the ISM, respectively. About 13% of the centered nebulae could be bow shocks seen head- or tail-on. For the rest, the data disfavor explanations as remains of parental disks, supernova remnants of a previous companion, and dust production in stellar winds. The existence of centered nebulae also at high Galactic latitudes strongly limits the global risk of coincidental alignments with condensations in the ISM. Mass loss during binary evolution seems a viable mechanism for the formation of at least some of these nebulae. In total, about 29% of the IR nebulae (2% of all OBA stars in the BSC) may find their explanation in the context of binary evolution.
Key words: stars: early-type / stars: emission-line, Be / stars: rotation / binaries: general / circumstellar matter / dust, extinction
Full Tables B.1 and B.2 are only available at the CDS via anonymous ftp to cdsarc.u-strasbg.fr (130.79.128.5) or via http://cdsweb.u-strasbg.fr/cgi-bin/qcat?J/A+A/618/A110
© ESO 2018
1. Introduction
Recent observations indicate that about 70% of all O stars are members of interacting binary systems and undergo mass transfer phases at some point of their evolution (Sana et al. 2012). Close binary interactions thus strongly influence the evolution of a large number of massive stars (Podsiadlowski et al. 1992; Wellstein & Langer 1999; de Mink et al. 2014). Different interaction channels are possible, consisting of tidal interactions (Zahn 1975; de Mink et al. 2009), mass and angular momentum transfer via Roche lobe overflow (RLOF, Packet 1981; Shu & Lubow 1981), common-envelope (CE) phase (Paczynski 1976; Iben & Livio 1993), and stellar merger (Podsiadlowski et al. 1992; Wellstein et al. 2001; Tylenda et al. 2011).
The outcome of such binary interactions depends strongly on the initial mass ratio and the orbital separation of the system (de Mink et al. 2013). In wider systems, the mass transfer typically occurs when the donor expands after leaving the main sequence (MS, de Mink et al. 2013), commonly referred to as “case B mass transfer” (Kippenhahn & Weigert 1967). When mass is transferred during a sufficiently stable RLOF phase, the companion accretes the material and angular momentum and is spun up efficiently. In conservative mass transfer, the companion is able to accrete all material transferred from the primary, while in the non-conservative case, material is lost to the surroundings because the companion cannot accrete at the same rate (Petrovic et al. 2005; Tout 2012).
After the main mass transfer event in a binary, which could be a RLOF or a CE evolution, the mass donor will evolve through a phase as helium star before reaching its end stage. This is best confirmed in the low-mass regime by the so-called subdwarfs. Subdwars are (mostly) helium-core burning stars that have almost completely lost their hydrogen envelope and have a narrow mass distribution centered on 0.47 M ⊙. Subdwarfs are mainly divided into two groups, sdOs and sdBs, depending on their temperature, which can reach more than 50 000 K (Heber 2009, 2016).
In the intermediate- and high-mass regime, helium stars are expected to reach temperatures of up to 100 000 K (Yoon et al. 2010; Langer 2012; Götberg et al. 2017), which renders their direct detection difficult, such that only a few counterparts are known (Schootemeijer et al. 2018). However, strong evidence for their existence comes from the Be-X-ray binaries, which require an intermediate-mass helium star as neutron star progenitor (van den Heuvel & Rappaport 1987). For the most massive progenitors, the helium stars obtain strong winds and are easily identified as Wolf-Rayet stars with strong emission lines, such that the helium-star stage of binary evolution is again observationally well confirmed (Petrovic et al. 2005).
Depending on the initial masses of the two components, the mass donor will end up as a white dwarf (WD), a neutron star (NS), or a black hole (BH; Portegies Zwart 1995; Han et al. 2002). WDs are difficult to detect in massive binary systems because of their low luminosity and mass. They may, however, reveal themselves if they are interacting with their companion through mass transfer. Such systems appear as so-called cataclysmic variables (Robinson 1976), Supersoft X-Ray Sources (Kahabka & van den Heuvel 1997) or symbiotic binaries (Kenyon & Webbink 1984), in which matter is accreted from the companion onto the WD via an accretion disk.
If the initial mass of the primary is sufficiently high, the interaction may result in the formation of an NS (Rappaport & van den Heuvel 1982) or even a BH (Zhang et al. 2003; Casares et al. 2014). Because material is also accreted onto the compact object, these systems are strong X-ray sources, known as X-ray binaries (XRBs). They can be detected out to large distances because of this strong but transient X-ray emission (Haberl & Sasaki 2000; Reig 2011). When forming an NS, the primary is disrupted in a supernova (SN) explosion. The sudden mass loss caused by the ejection of the exploding star’s envelope drastically changes the binary parameters and can lead to the breakup of the system. For a circular orbit, and if the NS birth kick is neglected, the system remains bound if the ejected mass is lower than half the total system mass (Blaauw 1961). Owing to asymmetries in the supernova, a kick can be induced in a random direction that might hinder or support the breakup of the system (Martin et al. 2009).
Massive stars in close binary systems with similar initial masses and short periods may even merge, forming a fast-rotating single star (Podsiadlowski et al. 1992). In addition to the fast rotation, the product of a stellar merger may show higher abundances of processed material (e.g., nitrogen), and appears rejuvenated compared to other stars in the same stellar population (Glebbeek et al. 2013). During the merging process, the huge excess of angular momentum can lead to the ejection of mass (between 2 and 8% of the total mass of the system), depending on the initial mass ratio and the evolutionary status of the stars (Glebbeek et al. 2013). In mergers of massive stars, a few solar masses might be lost, which would lead to the formation of a massive circumstellar nebula (Schneider et al. 2016). The material in such nebulae dissipates on timescales shorter than 10 000 yr (Schneider et al. 2016), limiting their observability.
Systems with extreme mass ratios evolve into a CE phase directly after the onset of mass transfer (de Mink et al. 2013), in which both stars orbit each other inside a single, shared envelope (Ivanova et al. 2013). CE phases are thought to be too short to lead to a substantial spin-up of the companion (de Mink et al. 2013; Shao & Li 2014). However, both RLOF (Packet 1981) and stellar mergers (Podsiadlowski et al. 1992) can result in the formation of fast-rotating stars as the angular momentum transfer spins up the companion star significantly (Sills et al. 2005; de Mink et al. 2013).
Several authors have predicted that if the companion is a B star, such spin-up in a binary system will turn it into a Be star (Packet 1981; Rappaport & van den Heuvel 1982; Pols et al. 1991). Classical Be stars are defined as “rapidly rotating main-sequence (MS) B-type stars that are forming an outwardly diffusing gaseous, dust-free Keplerian disk” (Rivinius et al. 2013, but see also Collins 1987). The process that transports matter onto a Keplerian orbit is still unknown but probably involves the combination of near-critical rotation and nonradial pulsation (Rivinius et al. 1998; Baade et al. 2018). In the disk, the material is governed by viscosity (Lee et al. 1991; Carciofi et al. 2009) and leads to prominent Balmer emission lines (Rivinius et al. 2013).
Binary population synthesis studies show that it cannot be excluded that most (or even all) Be stars are formed through mass exchange with or without subsequent merger (Vanbeveren & Mennekens 2017). Other possible pathways that lead to fast rotation are that the stars could be born as fast rotators (Bodenheimer 1995; Martayan et al. 2007) or spin up during MS evolution when angular momentum from the core is transferred onto the envelope (Ekström et al. 2008) and, perhaps, by nonradial g-mode pulsations. Possibly, not all Be stars are spun up by the same process, but some or all of these models play an important role (see, e.g., McSwain & Gies 2005; Huang et al. 2010). As the models are not mutually exclusive, however, a single-model-specific tracer is required to distinguish between them.
Here, we report on a search for hints of close-binary interactions by investigating the stellar surroundings at mid-IR wavelengths in different input samples of early-type stars that we visually inspect in WISE 22 μm data. On the one hand, we investigate the surroundings of three lists of peculiar subtypes of stars, that is, Be stars, BeXRBs, and Be+sdO systems. On the other hand, to place these searches in a broader context, we also inspect the surroundings of all ∼3800 OBA stars in the Bright Star Catalogue (BSC, Hoffleit & Jaschek 1991) consisting of all stars with V ≤ 6.5. We characterize the stars by a literature search, explore the origin and nature of the nebulae, and discuss their formation in the context of binary evolution.
2. Sample selection and morphological classification
2.1. Sample selection and visual inspection
We investigate the surroundings of stars belonging to four input samples in WISE 22 μm data (Wright et al. 2010). The main sample is taken from the BSC, a catalog of all stars with V mag 6.5 or brighter, and consists of all 3768 OBA stars (i.e., 1962 A stars, 1756 B stars, and 50 O stars). The BSC appears as a suitable source for this type of study. On the one hand, it contains enough stars to draw statistically significant conclusions, and on the other hand, the stars are bright enough to have been well studied in the literature. The sample is mag limited, not volume limited, meaning that the volume probed by O stars is much larger than that of B or A stars. More specifically, for a limiting V mag of 6.5, the heliocentric distance probed with an O5 star is 1500 pc, while the distance probed by an A5 star is smaller than 100 pc. The BSC sample serves as a comparison baseline for our population-restricted samples of Be stars, BeXRBs, and Be+sdO systems.
The Be sample consists of all known Be stars in the BSC as identified by Zorec & Briot (1997) or classified as such in SIMBAD (Wenger et al. 2007), resulting in 234 candidates. Additionally, we inspected a list of 72 BeXRBs (Raguzova & Popov 2005), and the Be+sdO sample of Wang et al. (2018) comprised of 5 known Be+sdO binary systems, 8 candidate, and 4 potential candidate systems. An overview of the different samples is given in Table 1.
In our analysis of the BSC sample, all selected stars were inspected twice. In the first iteration, we used the WISE 22 μm images as the nebulae tend to be most prominent there. Only the brightest nebulae at 22 μm are also visible at other wavelengths, especially at 12 μm (WISE W3) or Hα. We checked for complementary Hα images from the SuperCOSMOS H-alpha Survey (SHS, Parker et al. 2005), but because of their rarity, we focused our investigation on the WISE data at 22 μm. The stars were examined by eye in image windows of 600″ × 600″, while the flux cuts were changed manually depending on the particular field. In this step, 318 stars were identified that show a clearly extended emission in WISE W4.
In a second and independent iteration, all selected stars were examined again. The image windows were increased to 1200″ × 1200″ to better evaluate the local surroundings. Here, we investigated not only the 22 μm images, but also RGB-images from the WISE data where the 22 μm band is shown in red, the 12 μm band in green, and the 3.4 μm band in blue.
During this second step, about 50 stars were rejected because the suspected extended IR emission could be identified as a second star very close to the target star becoming clear in the shorter wavelength bands. For the remaining 255 cases, we estimated fluxes and sizes of the nebulae from aperture photometry. As the nebulae exhibit different morphologies, the shape of each individual nebula was used instead of a circular aperture. This shape was determined by comparing the flux values in each pixel with the local background and its standard deviation σ. A pixel is defined to belong to the nebula when the flux was 10σ higher than the averaged background. These individual apertures were used to calculate the 22 μm flux of each nebula.
Overview of the inspected samples.
2.2. Morphological classification
We classified the extended emission with respect to the nebular morphology and the direction of proper motion of the stars. This is especially important for bow shocks (see Sect. 4.1.2). For these latter nebulae, we defined a misalignment angle α as the unsigned angle between the direction of proper motion of the star and the bow shock vector, connecting the position of the star with the apex of the bow shock.
We defined the following morphology groups (see Fig. 1), where the number in parentheses gives the final number of nebulae classified in this group:
-
Aligned bow shocks (34): nebulae that have a sickle-like shape, a clear offset between the star and the nebula, and a misalignment angle α ≤ 20∘ (within the errors of the proper motion vector).
-
Unaligned bow shocks (60): nebulae that have the sickle-like shape typical of bow shocks, a clear offset between the star and the nebula, but a misalignment angle α ≥ 20∘. This means that the apparent motion of the star is not aligned with the opening angle of the nebula.
-
Centered (52): clearly extended and not sickle-shaped nebulae, where the star is situated within the extent of the nebula. The shapes are mostly roundish, elliptical, diffuse, or asymmetric, with a wide range of irregular morphologies.
-
Unresolved (72): nebulae for which the image resolution in WISE is not good enough to classify the shape, that is, sickle-like shapes cannot be distinguished from round or circular nebulae. The lack of resolution means that no offset between nebula and star can be discerned.
-
Not classified (37): nebulae that cannot be unambiguously classified into one of the other groups because of field crowding, background contamination, or both.
After defining the morphology groups, we checked for 24 μm data from the Multiband Imaging Photometer for Spitzer (MIPS, Rieke et al. 2004) for all 255 nebulae. MIPS has a point spread function (PSF) size of 6″, thus twice the resolution as WISE (Rieke et al. 2004). Unfortunately, Spitzer did not perform an all-sky survey, so sky coverage is sparse and only 61 of the 255 nebulae found in WISE were observed by MIPS as well. In 25 of the 61 cases, the higher-resolution MIPS data allowed us to reclassify the nebular shape and estimate a misclassification error for the nebulae without MIPS data coverage.
Nineteen nebulae initially classified as aligned or unaligned bow shocks were observed with MIPS, but only in one case did the higher resolution lead to a reclassification. This indicates that the bow shock classification is robust at lower resolution as well, with a misclassification error of roughly 5%. For 23 nebulae classified as centered, higher resolution MIPS data were available, which in five cases revealed a previously hidden bow shock. This implies a misclassification rate for centered nebulae of 22%. Thirteen nebulae classified as unresolved in WISE have additional MIPS data. Six of the cases showed an offset in MIPS and revealed a bow shock not seen in the inspection of the WISE data, while three cases could be reclassified as centered nebulae, adding up to a reclassification in 70% of the cases. Five of the six not classified nebulae (i.e., 83%) observed by MIPS were reclassified into other groups. As expected, the classification of unresolved and not classified nebulae could be strongly improved by higher resolution data.
Figure 2 illustrates the possible misclassification paths arising from insufficient resolution. Additionally, bow shocks might have been classified as unaligned bow shocks and vice versa if the proper motion values taken from the literature were incorrect. This might be the case because for most of the stars, only Hipparcos (van Leeuwen 2007) proper motions are available. This error can be reduced with the 2nd Gaia data release, still pending at the time of writing, which should feature better proper motion values for the BSC stars.
For the statistical evaluation of the sample we set up a database containing literature information as well as the parameter values measured by us for all stars we found to be associated with nebulae. It is given in Tables B.1 and B.2 and can be accessed via the Centre de Données astronomiques de Strasbourg (CDS).
Table B.1 gives an overview over the parameters we gathered from the literature, including identifiers, coordinates, HD numbers, V-band mag, and spectral types, taken from SIMBAD. Additionally, we provide parallaxes p, proper motions μ, and radial velocities νrad with their respective errors for all available stars.
Table B.2 lists the parameters we derived. These include the final morphological classification we assigned to each nebula after inspection of the MIPS data and information about whether the star is a known Be star, has a nebulous spectrum, or is a known binary. We calculated distances d and measured angular sizes and total fluxes of the nebulae. For bow shocks and unaligned bow shocks, we give angular and linear distances R(0) between the position of the star and the apex of the bow shock and misalignment angles α as defined above. Additionally, we calculated space velocities of the stars from literature values for distance d, proper motion μ, and radial velocity νrad via (1)
(1)
Because of large errors both in distance and proper motion, we only give space velocities for stars for which the error in each individual measurement is < 30%.
 |
Fig. 1. Representative examples for each morphological group. From left to right: aligned bow shocks, unaligned bow shocks, and centered, unresolved, and not classified nebulae. All images are RGB images where red, green, and blue correspond to the WISE 22, 12, and 4.6 μm filters. The straight white lines show the proper motion corrected to the local standard of rest. Their length indicates the displacement of each star within 10 000 yr. The white bar at the bottom of each panel corresponds to 2′. |
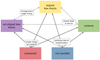 |
Fig. 2. Sketch of the possible misclassification paths between the defined morphology groups. |
3. Results
3.1. BSC stars with nebulae
We find that 255 of all OBA stars in the BSC (i.e., ∼7%) have associated extended IR nebulae, visible in WISE data at 22 μm. Of these, 14 are associated with O stars, 234 with B stars, and 7 with A stars. Because of the strong dependency on spectral type of the stellar content of the BSC, the fraction of nebulae, however, declines strongly toward later spectral types: 28% of all O stars, but only 13% of the B and 0.4% of the A stars are associated with IR nebulae. Of the 7 A stars with nebulae, 3 are supergiants with luminosity classes Ia and Ib (HD 21389, HD 20041, and ι 2 Sco) while 1 (ξ Cep) is classified as spectroscopic binary in SIMBAD.
Absolute and relative abundances of the morphological types of IR nebulae defined in Sect. 2.2 are provided in Table 2. Figure 1 shows a representative example of each morphological category. About 40% of all objects belong to the ambiguous groups of unresolved and not classified nebulae. The aligned bow shocks are the rarest objects in this sample, while 52 nebulae were classified as centered. Nebulae classified as centered might actually be bow shocks viewed head- or tail-on that appear roundish and centered on the star as a result of projection effects (see Sect. 4.1.5).
In Fig. 3 we show the association frequency of morphology types with spectral subtypes. The morphology types exhibit different dependencies on spectral type: The aligned bow shocks are the main reason for the overall decline in spectral type: while the fraction is highest for O stars, it decreases strongly toward later spectral types. Unaligned bow shocks are also less frequent around later-type stars, but the decline is not as strong as for the aligned bow shocks. Centered nebulae can be found at all spectral types with a peak around B1–B2.
As demonstrated in Fig. 4, we find an accumulation of nebulae along the Galactic plane as well as tracing Gould’s Belt. Gould’s Belt is a ring-like region tilted with respect to the Galactic plane by 16–20∘, in which large OB associations are located, that is, the Orion, Ophiuchus, and Cygnus star-forming regions (Poppel 1997), which contain many young O and B stars and atomic and molecular gas (Perrot & Grenier 2003). However, the association with IR nebulae is not restricted to a narrow strip around the Galactic plane, and nebulae are also found at higher latitudes.
Figure 5 shows the space velocity distribution for each of the morphological categories. As mentioned in Sect. 2.2, we only calculated space velocities for the stars with individual errors in d, μ, and νrad < 30%. The total space velocity of stars associated with aligned bow shocks is on average higher than the velocity of the stars associated with other morphological types: all nebulae associated with stars with velocities higher than 60 km s−1 are aligned bow shocks. On the other hand, there are also a few aligned bow shocks around low-velocity stars. Centered nebulae can be found around stars with velocities of up to 40 km s−1, while unresolved and not classified nebulae are associated with stars with velocities up to 60 km s−1.
Classification scheme based on the shape of the nebulae associated with BSC stars, the misalignment angle α, and the spatial offset between the star and the nebula.
3.2. Subsamples
Here we investigate the stars included in the three subsamples defined in Sect. 2.1 for associations with IR nebulae. We employed the same inspection approach as for the BSC sample described in Sect. 2.1.
Be stars. Of the 234 inspected Be stars, 34 (i.e., 15%) are associated with IR nebulae. This can be compared to the fraction of normal B stars (excluding the Be stars) with associated nebulae, which is 13%. Among these 34 nebulae, there are 4 aligned bow shocks, 7 unaligned bow shocks, and 11 centered nebulae. This means that in total, 1% of all the Be stars are associated with aligned bow shocks, 3% with unaligned bow shocks, and 5% with centered nebulae.
More B stars in the BSC might be Be stars as the Be phenomenon is transient and might not be detected as such in observations with limited time coverage. This would influence the ratio between B and Be stars in the BSC and thus the comparison between the fraction of B and Be stars associated with nebulae. Eight Be stars with nebulae were also observed with MIPS. However, in none of these cases did the additional higher resolution data change the morphological classification.
BeXRBs. We investigated a total of 72 BeXRBs, among which we found 4 associations with IR nebulae and 15 uncertain cases. As BeXRBs are typically detected through their strong X-ray emission (see Sect. 1), they are observed to much larger distances than the typical B stars in the BSC sample. Only 4 BeXRBs are within the optical brightness limits of the BSC. Two of these are associated with an IR nebula: γ Cas (not classified) and μ 2 Cru (centered). The detection of the other 2 nebulae around BeXRBs, where the stars are too faint to be included in the BSC, should be considered with caution, as the stars are probably at much larger distances. Hence the risk of chance alignments with ISM structures increases, especially for objects relatively close to the Galactic plane. This is the case for γ Cas and μ 2 Cru: they are within ±6∘ of the Galactic plane. Only μ 2 Cru was observed by MIPS, but this did not change its morphological classification.
Be+sdOs. Of the 5 known Be+sdOs and the 12 candidate and potential candidate systems, 3 (HD 41335 and HD 214168, both centered, and ϕ Per, not classified) are associated with IR nebulae and 1 case is uncertain (59 Cyg, not classified). The clear detections are also part of our BSC sample. Only for HD 41335 are MIPS data available that confirm the classification as centered nebula.
The findings for these three subsamples are summarized in Table 3. Because of incompleteness of the input catalogs, the absolute numbers can only be lower limits, especially for the Be+sdO systems, which are difficult to identify. Absolute and relative numbers are of course subject to classificational uncertainties, as described in Sect. 2.2.
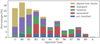 |
Fig. 3. Associations of different morphology groups with spectral types. Because of their low numbers, O and A stars are not divided into subtypes. The fractions are given with respect to the total number of stars of the respective spectral type in the BSC. |
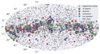 |
Fig. 4. Distribution of all O, B, and A stars in the BSC over the sky (gray dots, transparent for better visibility). The BSC stars associated with different morphological types of IR nebulae are identified with the symbols explained in the legend. The Ophiuchus star-forming region is marked by a circle. |
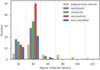 |
Fig. 5. Distribution of space velocities of the BSC stars calculated from Eq. (1). The colors correspond to the different morphological groups as indicated in the legend. |
4. Discussion
4.1. BSC sample
4.1.1. Unresolved and not classified nebulae
As described in Sect. 2.2, about 70% of the nebulae unresolved by WISE may be resolved with a twice narrower PSF. Accordingly, about 47 or more of the total of 68 unresolved nebulae without MIPS data might be reclassified at higher resolution. Applying corresponding statistical corrections, we estimate that about 31 might be bow shocks, 16 might be centered nebulae, and 21 would still be unresolved. Their individual genuine character can, however, only be derived from higher-resolution data. The large number of unresolved nebulae with a space velocity >30 km s−1 additionally indicates that a majority of them could be hidden bow shocks. In addition to the unresolved nebulae, we do not take into account the not classified nebulae in the following as in the context of this work no information can be drawn from them.
4.1.2. Aligned bow shocks
Bow shocks develop when the relative velocity between a star with a strong stellar wind and the local ISM is supersonic (see, e.g., van Buren & McCray 1988; Comerón & Kaper 1998; del Valle & Romero 2012). The size and brightness of a bow shock are defined mainly by three parameters: Theoretical modeling shows that a higher relative velocity as well as a higher density of the ambient ISM leads to smaller bow shocks, while their size increases with increasing wind strength and the thereby induced mass loss (Meyer et al. 2014, 2016). Stellar winds are generally stronger in more massive stars, leading to the expectation that bow shocks are more common and prominent around earlier-type stars. In the case of later-type (i.e., late-B and A-type) stars the radiation pressure on dust grains might lead to the formation of a bow shock (van Buren & McCray 1988; Ochsendorf et al. 2014).
Historically, the formation of a bow shock was attributed to a high stellar velocity with respect to its surroundings (van Buren et al. 1995; Kaper et al. 1997). The stars producing such bow shocks are called runaway stars and typically move at a high peculiar velocity > 30 km s−1 (Blaauw 1961; Gies & Bolton 1986). The runaway population is dominated by O stars (Stone 1991) that are observed outside of star-forming regions, indicating that they moved away from their place of formation (Silva & Napiwotzki 2011). Two possible mechanisms may lead to a high peculiar velocity: (i) expulsion from an SN-disrupted binary (see Sect. 1 and Blaauw 1961; Tauris & Takens 1998), and (ii) encounters between a close binary system and a tertiary star or another binary system in the parental cluster, which can lead to the ejection of one of the stars (Poveda et al. 1967). Observations indicate that both mechanisms are playing an important role (Hoogerwerf et al. 2000).
The alignment in our first morphological group between the motion of the stars and the sickle shape of the associated bow shocks implies that the associated stars are high-velocity stars. The steep decline with spectral type (see Fig. 3) agrees with the theoretical prediction that bow shocks are stronger around earlier-type stars as they have much stronger winds. A majority of the A stars with bow shocks are either supergiants or in a binary system. While MS A stars in general have no winds of any relevance, supergiants probably do have a wind strong enough for the formation of a bow shock (McCarthy et al. 1997). The recent observation of a bow shock around the red supergiant star IRC-10414 (Gvaramadze et al. 2014) further supports this.
Additionally, the decline with spectral type reflects the fact that the population of high-velocity stars is dominated by early-type stars. Most aligned bow shocks in our sample are associated with stars that have high space velocities (i.e., up to 120 km s−1, see Fig. 5). A small number of outliers has νspace < 30 km s−1, probably indicating that in these cases the ISM motion dominates the relative motion and is by chance aligned with the stellar motion (see next subsection).
Because the velocity gain of at least some runaway stars arises from their binary origin, the 34 stars with bow shock nebulae (i.e., 13% of all the stars with nebulae) can be placed in the context of binary evolution. Additionally, by using aligned bow shocks as indicators of high-velocity stars, we can crudely estimate their fraction in our limited sample of 50 O stars. We find 9 associations between O stars and aligned bow shocks, that is, almost 20%. This agrees well with other studies that found a high-velocity star fraction between 10% (Blaauw 1961; Gies & Bolton 1986) and 27% (Tetzlaff et al. 2010).
4.1.3. Unaligned bow shocks
Recent observational studies showed that bow shocks are not restricted to stars that move with high space velocities (Povich et al. 2008; Kobulnicky et al. 2016). Large-scale motions within the ISM can also be responsible for high relative velocities between star and ISM (Povich et al. 2008). Our morphological group of unaligned bow shocks supports this finding: stellar motion with respect to the ISM cannot be the driving force in the formation of these bow shocks.
As described in Sect. 3.1, unaligned bow shocks are associated with all spectral types we studied. This agrees well with theory: The main part in this interaction is the motion of the ISM, not stellar motion. As described before, O stars are favored as nuclei of bow shocks for two reasons: their strong winds, and high velocities. While the role of the wind should not depend much on the stellar space velocity with respect to the ambient ISM, the velocity threshold for the occurrence of bow shocks is obviously lower if the ISM also contributes much to the relative velocity between star and ISM. It is therefore not surprising that the fraction of early-type B stars with unaligned IR nebulae, which have weaker winds, is larger than that of aligned bow shocks (Fig. 3). In B stars in general, the formation of a bow shock depends more strongly on the ISM contribution to the relative velocity. This is confirmed by the distribution of space velocities of the stars with unaligned bow shocks: as shown in Fig. 5, the space velocity of these stars is in general significantly lower than for the aligned bow shocks, that is, mostly < 40 km s−1.
Unaligned bow shocks can be used as tracers of large-scale ISM motions (Kiminki et al. 2017). Such motions are common in star-forming regions where they are created by the copious winds of hot stars (Kudritzki & Puls 2000) and multiple previous SN explosions (de Avillez & Breitschwerdt 2010). The Ophiuchus star-forming region, for example, clearly shows an overabundance of unaligned bow shocks (encircled in Fig. 4). Accordingly, the defining link between bow shocks and high stellar velocity is relaxed. The basic physics of aligned and unaligned bow shocks, however, remains the same because of the roughly spherical symmetry of the stellar winds.
4.1.4. Comparison to Kobulnicky et al. (2016)
Kobulnicky et al. (2016) carried out a comprehensive visual inspection of existing space-based imaging IR surveys, and presented a new catalog of candidate bow shock nebulae containing 708 objects. In a follow-up paper, they performed aperture photometry and derived spectral energy distributions (SEDs) for all the objects (Kobulnicky et al. 2017). For candidate bow shocks, the authors imposed the following classification criteria: the nebulae must have an arc shape, a high degree of symmetry, and at least one prominent star located near the axis of symmetry. Subsequently, they classified the detected nebulae into four groups depending on their environment: bow shocks located in apparently isolated environments (70% of all nebulae), facing H II regions, facing bright-rimmed clouds, and located within H II regions. They called the latter “in situ” bow shocks, indicating that these bow shocks do not originate from the fast motion of a high-velocity star, but from ISM motion.
Reliable proper motion data are only available for ∼20 % of their stars. In one-quarter of the latter, the position angle of the bow shock is found to be aligned with the direction of the proper motion. This value is lower than the fraction of aligned bow shocks (34) of all bow shocks (94) in the BSC, which is 36%. It has to be noted, however, that Kobulnicky et al. defined bow shocks as aligned if the misalignment angle α is ≤45∘, while our cutoff is ≤20∘. Their derived fraction of aligned bow shocks is nevertheless lower than ours, which might at least partly be explained by the fact that, in contrast to our study, their proper motion vectors were not corrected for the local standard of rest.
The approaches used by Kobulnicky et al. and by us are complementary to each other: Kobulnicky et al. searched for IR nebulae with bow shock morphologies, classified them according to their environment, and then studied their association with stars, whereas we searched all OBA stars in the BSC for an associated IR nebula. Therefore, our analysis permits inferences to be made not only about the incidence of strong interactions between stellar winds and the ISM, but also about ISM-independent processes that may lead to the formation of IR nebulae associated with OBA stars. Moreover, Kobulnicky et al. inspected archival MIPS images mostly covering the inner Galactic plane at latitudes between |b|≤1∘, and complementary WISE data at latitudes up to |b|≤2∘. In contrast, our study covers the whole sky (therefore it mostly depends on the lower resolution WISE data), but is not restricted to bow shocks. We start from a (mag-limited) sample of bright stars of spectral types O, B and A and search for associated nebulae of any morphology.
A comparison between the nebulae found by Kobulnicky et al. and our sample yields only a small overlap of 11 stars (5 aligned and 6 unaligned bow shocks; by definition of the Kobulnicky et al. sample, there are no common objects with other structures). Of these 11, 10 fall into Kobulnicky et al.’s category of “isolated” environments (as the majority of their sample, i.e., 70 %), and 1 unaligned bow shock is “facing an H II region”. As mentioned in Sect. 3.1, we only have 14 O stars associated with IR nebulae in our sample. It is thus interesting to note that 5 of the 11 stars in the overlap are associated with O type stars and the rest are associated to B0 stars. A possible reason for the restriction of common objects to very early-type stars could be the clustering of these objects around the Galactic plane. The overall small overlap could be due to the different input data: while our search includes all OBA stars within a certain brightness limit in the whole sky, Kobulnicky et al. focused on a small region close to the Galactic plane without taking into account the spectral type or brightness of the associated star.
4.1.5. Centered nebulae
Our third morphology group consists of all nebulae in which the emission is centered on the star. The shape of these nebulae is circular, elliptical, or diffuse. Possible explanations for the formation of IR nebulae without obvious offset from the associated star include the following.
-
Some of the centered nebulae could be bow shocks viewed head- or tail-on. Their associated stars should exhibit small proper motions, that is, low tangential velocities, but fast radial velocities. We calculated space velocities for 50 of the 52 centered nebulae (the remaining 2 were omitted because of high uncertainties in distance and proper motion, see Sect. 2.2). Of these 50, only 2 stars have a high tangential velocity νtan > 30 km s−1, while 2 others have radial velocities νrad > 30 km s−1. Additionally, the abundance of associations with centered nebulae depends on spectral type. A peak is visible at spectral types B1/B2, implying that not all centered nebulae are bow shocks viewed head- or tail-on.
In Appendix A we compare the distribution of apex distances of bow shocks to the distribution of radii of centered nebulae. We calculated the radii from the physical sizes of the nebulae assuming that all nebulae have a circular shape. As the centered nebulae are not all spherically symmetric, and because the measured apex distance is a projected quantity, we do not expect the underlying distributions to be similar. We tested the similarity of the two distributions by means of a Kuiper test, which indicated that we cannot distinguish between them at a 2σ level.
Acreman et al. (2016) computed synthetic IR emission maps for bow shocks viewed at inclination angles 30∘, 60∘, and 90∘ smoothed to the resolution of WISE W4 (see their Fig. 3). The authors found a “noticeable asymmetry” of the nebula “with a peak ahead of the star” already at an inclination of 30∘ that becomes a more clearly identifiable bow shock at higher inclinations. We thus assume that bow shocks seen under inclination angles ≤30∘ appear spherical with WISE. Assuming a continuous distribution of bow shock orientations in the sky, the fraction of bow shocks viewed head- or tail-on is given by the integral of a random distribution of angles from 0∘ to 30∘, that is, 1 − cos(30∘)=13%. This implies that at least 13% of all bow shock nebulae would be classified as centered nebulae because of their head- or tail-on orientation. This indicates that the 94 bow shock nebulae we found correspond to 87% of the total bow shock population (i.e., 108 nebulae), and that at least 11 centered nebulae should be bow shocks viewed head- or tail-on. Applying this additional possible misclassification to all centered nebulae statistically reduces their number from 52 to at most 41, that is, 16% of all nebulae.
-
The IR emission could arise in the remains of the parental disk in which the star formed. However, these disks are transient structures with lifetimes on the order of a few million years. The lifetimes steeply decrease with the mass of the star (see, e.g., De Marchi et al. 2013; Pfalzner et al. 2014) because the strong stellar irradiation leads to disk dissipation (Haisch et al. 2001). This is much shorter than the typical MS lifetime of early-type stars (e.g., ∼2 × 10⁸ yr for B5V, Ekström et al. 2012). Moreover, protostellar disks are smaller than 1000 AU ≈ 5 × 10⁻³ pc (Williams & Cieza 2011), whereas the typical radii of the observed IR nebulae of 0.5 pc are 100 times larger.
-
The nebulae could be the remnants of a supernova explosion of a companion star. For a typical radius of 0.5 pc of the IR nebulae in question and typical expansion velocities of supernova remnants (5000 km s−1, Hayato et al. 2010), putative SN explosions would have taken place 100 years ago, i.e. during historical times. A typical absolute luminosity of core-collapse SNe is −17 mag in V (Richardson et al. 2014), which is about 14 mag brighter than that of a B1V star (Wegner 2006). Therefore, even the faintest B1V star in the BSC at mV = 6.5 would have shone at MV = − 7.5 around maximum, which is 10 000 times brighter than Sirius. There is no record of such events.
-
The IR emission could arise in surrounding dust that is heated by the star. This could either be dense ISM clouds that are independent of the star, or dust formed by the star itself. Additional observations of one peculiar nebula around a classical Be star, HD 303056 (classified as B3 in SIMBAD), indicated a nebular density of nneb = 56 ± 5 cm−3 (Bodensteiner, Master thesis, unpublished; Bodensteiner et al., in prep.). The typical density of the ISM, however, is nISM ≈ 1 cm−3 (Ferriere 2001). Therefore, if this dust is unrelated to the star and part of the ISM, the density of the latter would have to be accidentally increased by nearly two orders of mag, which seems very unlikely.
Figure 4 demonstrates that the association of nebulae is not restricted to a narrow strip around the Galactic plane. It extends to higher Galactic latitudes, showing that such nebulae do not only occur in regions of dense ISM where the probability of both physical and apparent associations is highest. This suggests that some of the IR nebulae without bow-shock appearance may not require the ISM, but are formed by the associated stars in some other way.
Two basic conditions must be fulfilled in stars in order to produce dust: the temperature of the material must be below the dust condensation temperature of around 1500 K (Hoefner et al. 1998), and the density must be high (Andersen 2007). These conditions are fulfilled for example in AGB stars (Ferrarotti & Gail 2006), or in evolved massive stars like luminous blue variables (LBVs) or Wolf-Rayet (WR) stars (Toalá et al. 2015).
The mass-loss rate of AGB stars is between 10−8 and 10−4 M⊙ yr−1 (Habing 1996; Kemper et al. 2001), leading to the formation of circumstellar nebulae (Wood et al. 2004; Suh 2004). LBVs show stellar outbursts and episodes of high mass loss during which the stars lose significant fractions of their initial mass (Humphreys & Davidson 1994; Smith 2014). The wind mass loss rates of LBVs is typically 10−5 to 10−4 M⊙ yr−1 (Lamers & Fitzpatrick 1988; Smith et al. 2004; Groh et al. 2009). Several dusty nebulae are known around LBVs (Weis 2003; Gvaramadze et al. 2009).
The mass loss in MS B stars is in general very small compared to these numbers. B0 stars can have a mass loss of up to 10−9 M⊙ yr−1. This number, however, decreases strongly with effective stellar temperature. Below 15 000 K, no homogeneous line-driven wind is possible (Krticka 2014), making the mass loss completely ineffective in terms of the formation of such nebulae.
-
The IR nebulae could be formed by non-conservative mass transfer during RLOF or in a stellar merger. Depending on the type of interaction, the remaining star would be effectively single (i.e., when the two components have merged) or have a compact companion (i.e., a WD, sdO, NS, or even a BH). As the least massive of these compact companions, WDs and sdOs, are hard to detect, many of them, if they exist, may have remained undetected. The nebulae would then become visible because the ejected material is heated by the absorption of photons from the OB star, and in the case of RLOF, additionally by the compact companion. These compact companions, especially sdOs, have very high temperatures and thus emit around 100 times more highly energetic photons than an early-type star (the number of ionizing photons for an sdO is 1048 s−1 (Götberg et al. 2017), while a B1 type star with an effective temperature of ∼26 000 K typically emits 1046 s−1 (Diaz Miller et al. 1998). Additionally, the temperature of sdOs remains high for a long time, increasing the visibility period of such nebulae.
This, perhaps still incomplete, multitude of possibilities shows that centered nebulae do not have a unique straightforward explanation. We can exclude that they are the remains of the parental disk or remnants of a previous SN explosion of a possible companion star, however. Because of the negligible mass loss of the stars in comparison to known dust-producing stars like AGBs, LBVs, or WR stars, it also seems unlikely that single stars produced the dust. Finally, some of the centered nebulae could be bow shocks viewed head- or tail-on.
In conclusion, we propose that the formation of most of the remaining centered nebulae (i.e., 16% of all nebulae) is related to binary interactions by non-conservative mass transfer either during RLOF or a stellar merger.
4.2. Subsamples
4.2.1. Be stars
The search for nebulae within the Be subsample yields three main results. First, we find a similar fraction of nebulae around Be stars as around normal B stars. This indicates that the presence of a circumstellar disk, which is the main characteristics of a Be star, is not significantly causal for the presence of an IR nebula.
Second, the fraction of centered nebulae around Be stars is marginally higher than around normal B stars. While 11 of the 34 Be stars, that is, 32%, are found to be associated with centered nebulae, this holds only for 39 of the 200 normal B stars (excluding Be stars) in the BSC, that is, 20%. The B stars in the BSC also include supergiants with strong winds. Therefore, if the distribution of space velocities of B and Be stars is about the same, the smaller percentage of Be stars with centered nebulae confirms that winds are not generally important for the formation of centered nebulae.
Third, four Be stars are associated with aligned bow shocks. Berger & Gies (2001) found the fraction of high-velocity stars among Be stars to be slightly higher than the fraction among normal early-type B stars (i.e., 3%–7% in comparison to ≈2%). They concluded that the existence of high-velocity Be stars indicates that at least some of the Be stars are formed in binaries. This is in agreement with our conclusion: the four Be stars with bow shocks probably gained their high velocity in previous binary interactions.
In total, this indicates that 11 + 4 out of 234 inspected Be stars, that is, 6%, are associated with nebulae that can be linked to binary interactions. In comparison, we found 39 centered nebulae +20 aligned bow shocks associated with the 1522 normal B-type stars in the BSC, implying a fraction of 4%. The absolute numbers of star-nebula pairs and the corresponding fractional difference between Be and B stars, 6% vs. 4%, are small, however. Therefore, on the basis of our data, we cannot claim to see strong evidence that binarity is the physical cause of the Be star phenomenon.
The first detection of an elongated, asymmetric IR nebula in WISE data at 22 μm around a Be star was 48 Lib (B3 IVe; Griffith et al. 2015), a shell star (i.e., viewed equator-on; Hanuschik & Vrancken 1996). Interferometric observations constrained the orientation in space (i.e., the tilt angle with respect to the plane of the sky) of this circumstellar decretion disk (Pott et al. 2010), while its position angle was determined by linear polarimetry (Štefl et al. 2012). Despite a difference in size of 5 orders of mag, the IR nebula visible in WISE seems to be parallel (Griffith et al. 2015) to the circumstellar decretion disk, indicating a common axis of rotation.
Recently, an elliptical, that is, centered nebula around the classical Be star HD 303056 was discovered in MIPS data at 24 μm by Vasilii Gvaramadze (priv. comm.), which we will investigate in detail in a follow-up paper (Bodensteiner et al., in prep.). The presence and characteristics of such circumstellar nebulae around Be stars could give further indications pointing toward their binary origin.
4.2.2. BeXRBs and Be+sdO systems
No aligned bow shocks were found around BeXRBs and Be+sdO systems. As discussed above, aligned bow shocks are formed by high-velocity stars, whereas the standard process of formation of BeXRBs and Be+sdO systems, mass transfer during RLOF, does not impart great velocity kicks to the systems. BeXRBs and Be+sdO systems are thus still bound in the original binary system. In the case of BeXRBs, this indicates that the binary system was not disrupted in the SN explosion of the companion.
The centered nebulae associated with one BeXRB and two Be+sdO systems might be the left-over material lost in previous binary interactions in which the primary star evolved into a compact object and the secondary was spun up to become a Be star. The low numbers, however, prevent us from any further statistical inferences.
5. Conclusions
We discovered a large number of IR nebulae associated with early-type stars. In addition to 4 BeXRBs, 3 Be+sdO systems, and 34 Be stars (with mostly unknown binary status) with extended IR nebulae, we detected 255 nebulae around OBA stars in the Bright Star Catalogue.
Among the 255 nebulae around BSC stars, we find that 94 nebulae have the typical sickle-like shape of a bow shock that forms when the relative velocity between star and surrounding ISM is supersonic. They can be subdivided into two groups: the first group, accounting for 13% of all nebulae, are bow shocks formed by high-velocity stars that probably gained their high velocity through close binary interactions. The second group (24%) supports the recent development in the understanding of bow shock formation. The missing alignment between proper motion and position angle of the apex of the bow shock indicates that not only a high stellar velocity, but also large-scale motions of the ISM produce bow shocks. This leads us to the assumption that in stars with aligned bow shocks, we see the combined effect of strong wind and high space velocity, while in not-aligned bow shocks, the high space velocity of the star itself is less relevant than the turbulent ISM motion. This is in agreement with the findings by Kobulnicky et al. (2016) and demonstrates that unaligned bow shocks can be used as tracers for large-scale ISM motions.
Using aligned bow shocks as indicators for high-velocity stars, we find a high-velocity star fraction of almost 20% in our limited sample of O stars. This agrees with earlier findings of Blaauw (1961), Gies & Bolton (1986), and Tetzlaff et al. (2010), for instance.
Furthermore, 52 centered nebulae have round, elliptical, or diffuse shapes. While ∼13% might be bow shocks viewed head-or tail-on, this explanation does not hold for the majority. We can exclude that the IR emission arises in the remains of the parental disk, and also that the nebulae are remnants of the SN explosion of a former companion star. Because of their low mass-loss rates, single MS B and A stars do not form dust. MS O stars and B and A supergiants can have a higher mass loss. They account only for a small fraction of the whole sample, however.
Finally, we propose that the remaining centered nebulae, that is, 16% of all nebulae, are formed in the context of previous binary interactions. The observed IR nebulae might be explained through dust formed during non-conservative mass transfer (either RLOF or a stellar merger) that is heated by the OBA star (and a compact companion, if merging was avoided). Such nebulae should show elevated metal abundances due to their formation history and have a short lifetime because of their expansion.
In total, we can conclude that (16 + 13)%, that is, about one-quarter to one-third, of the nebulae detected around OBA stars in the BSC can be placed in the context of binary evolution. On the one hand, they can be seen as an indication of the velocity gain by binary interaction leading to the formation of a bow shock. On the other hand, the nebulae can be direct observational evidence of the material lost in non-conservative mass transfer (i.e., in RLOF or a stellar merger) heated by the star (and a compact companion). Applying this to the number of O, A, and B stars in the BSC, we find that 8% of all O stars in the BSC, 4% of all B stars in the BSC, and 0.1% of all the A stars in the BSC are associated with IR nebulae that can be placed in the context of binary evolution. A majority of the A stars is, however, not single or not on the MS. The small difference between the fraction of B (4%) and Be stars (6%) with probably binarity-related companion IR nebulae is not significant enough to postulate a dominance of binarity in the formation of Be stars.
Our results encourage us to use the associations of IR nebulae with massive MS stars as a general tracer of past binary interactions. This could be further exploited by spectroscopic searches for companion stars. Companion detections would not only corroborate the conclusions of this paper, but would have the potential to give important new insights into the physical processes taking place in the different so far still poorly understood binary evolution and interaction channels.
Acknowledgments
We are particularly grateful to Vasilii Gvaramadze in pointing out the mid-IR nebula around HD 303056, which initiated this study, and to Thomas Rivinius and Alex C. Carciofi for helpful discussions during early stages of the project. We would like to thank Hugues Sana and Cole C. Johnston for valuable discussions concerning the paper and the referee for very helpful comments and suggestions. J.B. acknowledges support from the FWO_Odysseus program under project G0F8H6N. This publication makes use of data products from the Wide-field Infrared Survey Explorer, which is a joint project of the University of California, Los Angeles, and the Jet Propulsion Laboratory/California Institute of Technology, funded by the National Aeronautics and Space Administration. This work is partly based on archival data obtained with the Spitzer Space Telescope, which is operated by the Jet Propulsion Laboratory, California Institute of Technology under a contract with NASA. Support for this work was provided by an award issued by JPL/Caltech. This research has made use of the SIMBAD database, operated at CDS, Strasbourg, France and of NASA’s Astrophysics Data System Bibliographic Services.
References
- Acreman, D. M., Stevens, I. R., & Harries, T. J. 2016, MNRAS, 456, 136 [NASA ADS] [CrossRef] [Google Scholar]
- Andersen, A. C. 2007, in Why Galaxies Care About AGB Stars: Their Importance as Actors and Probes, eds. F. Kerschbaum, C. Charbonnel, & R. F. Wing, ASP Conf. Ser., 378, 170 [NASA ADS] [Google Scholar]
- Baade, D., Pigulski, A., & Rivinius, T. 2018, A&A, 610, A70 [NASA ADS] [CrossRef] [EDP Sciences] [Google Scholar]
- Berger, D. H., & Gies, D. R. 2001, ApJ, 555, 364 [NASA ADS] [CrossRef] [Google Scholar]
- Blaauw, A. 1961, Bull. Astron. Inst. Neth., 15, 265 [Google Scholar]
- Bodenheimer, P. 1995, ARA&A, 33, 199 [NASA ADS] [CrossRef] [Google Scholar]
- Carciofi, A. C., Okazaki, A. T., le Bouquin, J.-B., et al. 2009, A&A, 504, 915 [NASA ADS] [CrossRef] [EDP Sciences] [Google Scholar]
- Casares, J., Negueruela, I., Ribó, M., et al. 2014, Nature, 505, 378 [NASA ADS] [CrossRef] [Google Scholar]
- Collins, G. W. 1987, in Physics of Be Stars, ed. A. Slettebak (Cambridge, New York: Cambridge University Press), 3 [Google Scholar]
- Comerón, F., & Kaper, L. 1998, A&A, 338, 273 [NASA ADS] [Google Scholar]
- Comerón, F., & Pasquali, A. 2007, A&A, 467, L23 [NASA ADS] [CrossRef] [EDP Sciences] [Google Scholar]
- de Avillez, M. A., & Breitschwerdt, D. 2010, in ASP Conf. Ser., eds. R. Kothes, T. L. Landecker, & A. G. Willis (San Francisco), 313 [Google Scholar]
- De Marchi, G., Panagia, N., Guarcello, M. G., & Bonito, R. 2013, MNRAS, 435, 3058 [NASA ADS] [CrossRef] [Google Scholar]
- de Mink, S. E., Cantiello, M., Langer, N., et al. 2009, A&A, 497, 243 [NASA ADS] [CrossRef] [EDP Sciences] [Google Scholar]
- de Mink, S. E., Langer, N., Izzard, R. G., Sana, H., & de Koter, A. 2013, ApJ, 764, 17 [Google Scholar]
- de Mink, S. E., Sana, H., Langer, N., Izzard, R. G., & Schneider, F. R. N. 2014, ApJ, 782, 8 [NASA ADS] [CrossRef] [Google Scholar]
- del Valle, M. V., & Romero, G. E. 2012, A&A, 543, A10 [NASA ADS] [CrossRef] [EDP Sciences] [Google Scholar]
- Diaz Miller, R. I., Franco, J., & Shore, S. N. 1998. ApJ, 192, 501 [Google Scholar]
- Ekström, S., Meynet, G., Maeder, A., & Barblan, F. 2008, A&A, 478, 467 [NASA ADS] [CrossRef] [EDP Sciences] [Google Scholar]
- Ekström, S., Georgy, C., Eggenberger, P., et al. 2012, A&A, 537, A18 [NASA ADS] [CrossRef] [EDP Sciences] [Google Scholar]
- Ferrarotti, A. S., & Gail, H.-P. 2006, A&A, 447, 553 [NASA ADS] [CrossRef] [EDP Sciences] [Google Scholar]
- Ferriere, K. M. 2001, Rev. Mod. Phys., 73, 1031 [NASA ADS] [CrossRef] [Google Scholar]
- Gies, D. R., & Bolton, C. T. 1986, ApJS, 61, 419 [NASA ADS] [CrossRef] [Google Scholar]
- Glebbeek, E., Gaburov, E., Portegies Zwart, S., & Pols, O. R. 2013, MNRAS, 3497, 434 [Google Scholar]
- Gontcharov, G. A. 2006, Astron. Lett., 32, 759 [NASA ADS] [CrossRef] [Google Scholar]
- Götberg, Y., de Mink, S. E., & Groh, J. H. 2017, A&A, 608, A22 [NASA ADS] [CrossRef] [EDP Sciences] [Google Scholar]
- Griffith, R. L., Wright, J. T., Maldonado, J., et al. 2015, ApJS, 217, 34 [Google Scholar]
- Groh, J. H., Hillier, D. J., Damineli, A., et al. 2009, ApJ, 698, 1698 [NASA ADS] [CrossRef] [Google Scholar]
- Gvaramadze, V. V., Kniazev, A. Y., & Fabrika, S. 2009, MNRAS, 405, 1047 [Google Scholar]
- Gvaramadze, V. V., Menten, K. M., Kniazev, A. Y., et al. 2014, MNRAS, 437, 843 [NASA ADS] [CrossRef] [Google Scholar]
- Haberl, F., & Sasaki, M. 2000, A&A, 359, 573 [NASA ADS] [Google Scholar]
- Habing, H. 1996, A&ARv, 7, 97 [NASA ADS] [CrossRef] [Google Scholar]
- Haisch, K. E., Lada, E. A., & Lada, C. J. 2001, AJ, 121, 2065 [NASA ADS] [CrossRef] [Google Scholar]
- Han, Z., Podsiadlowski, P., Maxted, P. L. F., Marsh, T. R., & Ivanova, N. 2002, MNRAS, 336, 449 [NASA ADS] [CrossRef] [Google Scholar]
- Hanuschik, R. W., & Vrancken, M. 1996, A&A, 312, L17 [NASA ADS] [Google Scholar]
- Hayato, A., Yamaguchi, H., Tamagawa, T., et al. 2010, ApJ, 725, 894 [NASA ADS] [CrossRef] [Google Scholar]
- Heber, U. 2009, ARA&A, 47, 211 [NASA ADS] [CrossRef] [Google Scholar]
- Heber, U. 2016, PASP, 128, 082001 [NASA ADS] [CrossRef] [Google Scholar]
- Hoefner, S., Jorgensen, U. G., Loidl, R., & Aringer, B. 1998, A&A, 340, 497 [NASA ADS] [Google Scholar]
- Hoffleit, D., & Jaschek, C. 1991, Bright Star Catalogue, 5th rev. edn. (New Haven, USA: Yale University Observatory) [Google Scholar]
- Hoogerwerf, R., de Bruijne, J. H. J., & de Zeeuw, P. T. 2000, ApJ, 544, L133 [NASA ADS] [CrossRef] [Google Scholar]
- Huang, W., Gies, D. R., & McSwain, M. V. 2010, ApJ, 722, 605 [NASA ADS] [CrossRef] [Google Scholar]
- Humphreys, R. M., & Davidson, K. 1994, PASP, 106, 1025 [NASA ADS] [CrossRef] [Google Scholar]
- Iben, Icko, J., & Livio, M. 1993, PASP, 1373, 105 [Google Scholar]
- Ivanova, N., Justham, S., Chen, X., et al. 2013, ARA&A, 21, 59 [Google Scholar]
- Kahabka, P., & van den Heuvel, E. P. J. 1997, ARA&A, 35, 69 [NASA ADS] [CrossRef] [Google Scholar]
- Kaper, L., van Loon, J., Augusteijn, T., et al. 1997, ApJ, 475, L37 [NASA ADS] [CrossRef] [Google Scholar]
- Kemper, F., Waters, L. B. F. M., de Koter, A., & Tielens, A. G. G. M. 2001, A&A, 369, 132 [NASA ADS] [CrossRef] [EDP Sciences] [Google Scholar]
- Kenyon, S. J., & Webbink, R. F. 1984, ApJ, 279, 252 [NASA ADS] [CrossRef] [Google Scholar]
- Kharchenko, N. V., Scholz, R. D., Piskunov, A. E., Röser, S., & Schilbach, E. 2007, Astron. Nachr., 328, 889 [NASA ADS] [CrossRef] [Google Scholar]
- Kiminki, M. M., Smith, N., Reiter, M., & Bally, J. 2017, MNRAS, 468, 2469 [NASA ADS] [CrossRef] [Google Scholar]
- Kippenhahn, R., & Weigert, A. 1967, Z. Astrophys., 65, 251 [NASA ADS] [Google Scholar]
- Kobulnicky, H. A., Chick, W. T., Schurhammer, D. P., et al. 2016, ApJS, 227, 18 [NASA ADS] [CrossRef] [Google Scholar]
- Kobulnicky, H. A., Schurhammer, D. P., Baldwin, D. J., et al. 2017, AJ, 154, 18 [NASA ADS] [CrossRef] [Google Scholar]
- Krticka, J. 2014, A&A, 564, A10 [NASA ADS] [CrossRef] [EDP Sciences] [Google Scholar]
- Kudritzki, R.-P., & Puls, J. 2000, ARA&A, 38, 613 [NASA ADS] [CrossRef] [Google Scholar]
- Lamers, H. J. G. L. M., & Fitzpatrick, E. L. 1988, ApJ, 324, 279 [NASA ADS] [CrossRef] [Google Scholar]
- Langer, N. 2012, ARA&A, 50, 107 [NASA ADS] [CrossRef] [Google Scholar]
- Lee, U., Saio, H., & Osaki, Y. 1991, MNRAS, 250, 432 [NASA ADS] [CrossRef] [Google Scholar]
- Martayan, C., Frémat, Y., Hubert, A.-M., et al. 2007, A&A, 462, 683 [NASA ADS] [CrossRef] [EDP Sciences] [Google Scholar]
- Martin, R. G., Tout, C. A., & Pringle, J. E. 2009, MNRAS, 397, 1563 [NASA ADS] [CrossRef] [Google Scholar]
- McCarthy, J. K., Kudritzki, R., Lennon, D. J., Venn, K. A., & Puls, J. 1997, ApJ, 482, 757 [NASA ADS] [CrossRef] [Google Scholar]
- McSwain, M. V., & Gies, D. R. 2005, ApJS, 161, 118 [NASA ADS] [CrossRef] [Google Scholar]
- Meyer, D. M. A., Mackey, J., Langer, N., et al. 2014, MNRAS, 444, 2754 [NASA ADS] [CrossRef] [Google Scholar]
- Meyer, D. M. A., van Marle, A. J., Kuiper, R., & Kley, W. 2016, MNRAS, 459, 1146 [NASA ADS] [CrossRef] [Google Scholar]
- Ochsendorf, B. B., Cox, N. L. J., Krijt, S., et al. 2014, A&A, 563, A16 [NASA ADS] [CrossRef] [EDP Sciences] [Google Scholar]
- Packet, W. 1981, A&A, 102, 17 [NASA ADS] [Google Scholar]
- Paczynski, B. 1976, in Structure and Evolution of Close Binary Systems, eds. P. Eggleton, S. Mitton, & J. Whelan (Cambridge University Press), 75 [Google Scholar]
- Parker, Q. A., Phillipps, S., Pierce, M. J., et al. 2005, MNRAS, 362, 689 [NASA ADS] [CrossRef] [Google Scholar]
- Perrot, C. A., & Grenier, I. A. 2003, A&A, 404, 519 [NASA ADS] [CrossRef] [EDP Sciences] [Google Scholar]
- Petrovic, J., Langer, N., & van der Hucht, K. A. 2005, A&A, 435, 1013 [NASA ADS] [CrossRef] [EDP Sciences] [Google Scholar]
- Pfalzner, S., Steinhausen, M., & Menten, K. 2014, ApJ, 793, L5 [NASA ADS] [CrossRef] [Google Scholar]
- Podsiadlowski, P., Joss, P. C., & Hsu, J. J. L. 1992, ApJ, 391, 246 [NASA ADS] [CrossRef] [Google Scholar]
- Pols, O., Cote, J., Waters, L. B. F. M., & Heise, J. 1991, A&A, 241, 419 [NASA ADS] [Google Scholar]
- Poppel, W. 1997, Fund. Cosm. Phys., 18, 1 [NASA ADS] [Google Scholar]
- Portegies Zwart, S. F. 1995, A&A, 296, 691 [NASA ADS] [Google Scholar]
- Pott, J. U., Woillez, J., Ragland, S., et al. 2010, ApJ, 721, 802 [NASA ADS] [CrossRef] [Google Scholar]
- Pourbaix, D., Tokovinin, A. A., Batten, A. H., et al. 2004, A&A, 424, 727 [NASA ADS] [CrossRef] [EDP Sciences] [Google Scholar]
- Poveda, A., Ruiz, J., & Allen, C. 1967, Bol. Obs. Tonantzintla y Tacubaya, 4, 86 [Google Scholar]
- Povich, M. S., Benjamin, R. A., Whitney, B. A., et al. 2008, ApJ, 689, 242 [NASA ADS] [CrossRef] [Google Scholar]
- Raguzova, N. V., & Popov, S. B. 2005, Astron. Astrophys. Trans., 24, 151 [NASA ADS] [CrossRef] [Google Scholar]
- Rappaport, S., & van den Heuvel, E. P. J. 1982, in Be stars, eds. M. Jaschek, & H. G. Groth (Cambridge University Press), IAU Symp., 98, 327 [Google Scholar]
- Reig, P. 2011, Astrophys. Space Sci., 332, 1 [NASA ADS] [CrossRef] [Google Scholar]
- Richardson, D., Jenkins, R. L., Wright, J., & Maddox, L. 2014, ApJ, 147, 11 [Google Scholar]
- Rieke, G. H., Young, E. T., Engelbracht, C. W., et al. 2004, ApJS, 154, 25 [NASA ADS] [CrossRef] [Google Scholar]
- Rivinius, T., Baade, D., & Stefl, S. 1998, ASP Conf. Ser., 135, 343 [NASA ADS] [Google Scholar]
- Rivinius, T., Carciofi, A. C., & Martayan, C. 2013, A&ARv, 21, 69 [Google Scholar]
- Robinson, E. L. 1976, ARA&A, 14, 119 [NASA ADS] [CrossRef] [Google Scholar]
- Sana, H., de Mink, S. E., de Koter, A., et al. 2012, Science, 337, 6093 [Google Scholar]
- Schneider, F. R. N., Podsiadlowski, P., Langer, N., Castro, N., & Fossati, L. 2016, MNRAS, 457, 2355 [NASA ADS] [CrossRef] [Google Scholar]
- Schootemeijer, A., Götberg, Y., de Mink, S. E., Gies, D. R., & Zapartas, E. 2018, A&A, 615, A30 [Google Scholar]
- Shao, Y., & Li, X.-D. 2014, ApJ, 796, 13 [NASA ADS] [CrossRef] [Google Scholar]
- Shu, F. H., & Lubow, S. H. 1981, ARA&A, 19, 277 [NASA ADS] [CrossRef] [Google Scholar]
- Sills, A., Adams, T., & Davies, M. B. 2005, MNRAS, 358, 716 [NASA ADS] [CrossRef] [Google Scholar]
- Silva, M. D. V., & Napiwotzki, R. 2011, MNRAS, 411, 2596 [NASA ADS] [CrossRef] [Google Scholar]
- Smith, N. 2014, ARA&A, 52, 487 [NASA ADS] [CrossRef] [MathSciNet] [Google Scholar]
- Smith, N., Vink, J. S., & de Koter, A. 2004, ApJ, 615, 475 [NASA ADS] [CrossRef] [Google Scholar]
- Štefl, S., Bouquin, J. B. L., Carciofi, A. C., et al. 2012, A&A, 540, A12 [NASA ADS] [CrossRef] [EDP Sciences] [Google Scholar]
- Stone, R. C. 1991, AJ, 102, 333 [NASA ADS] [CrossRef] [Google Scholar]
- Suh, K.-W. 2004, J. Korean Astron. Soc., 37, 289 [NASA ADS] [CrossRef] [Google Scholar]
- Tauris, T. M., & Takens, R. J. 1998, A&A, 330, 1047 [NASA ADS] [Google Scholar]
- Tetzlaff, N., Neuhäuser, R., & Hohle, M. M. 2010, MNRAS, 410, 190 [Google Scholar]
- Toalá, J. A., Guerrero, M. A., Ramos-Larios, G., & Guzmán, V. 2015, A&A, 578, A66 [NASA ADS] [CrossRef] [EDP Sciences] [Google Scholar]
- Tout, C. A. 2012, IAU Symp., 282, 417 [NASA ADS] [Google Scholar]
- Tylenda, R., Hajduk, M., Kamiński, T., et al. 2011, A&A, 528, A10 [NASA ADS] [CrossRef] [EDP Sciences] [Google Scholar]
- van Buren, D., & McCray, R. 1988, ApJ, 329, L93 [NASA ADS] [CrossRef] [Google Scholar]
- van Buren, D., Noriega-Crespo, A., & Dgani, R. 1995, AJ, 110, 2914 [NASA ADS] [CrossRef] [Google Scholar]
- van den Heuvel, E. P. J., & Rappaport, S. 1987, in Proc. of the Ninety-second IAU Colloquium, Boulder, CO, eds. A. Slettebak, & T. P. Snow (Cambridge, New York: Cambridge University Press), 291 [Google Scholar]
- van Leeuwen, F. 2007, A&A, 474, 653 [NASA ADS] [CrossRef] [EDP Sciences] [Google Scholar]
- Vanbeveren, D., & Mennekens, N. 2017, ASP Conf. Ser., 508, 121 [NASA ADS] [Google Scholar]
- Wang, L., Gies, D. R., & Peters, G. J. 2018, ApJ, 853, 10 [NASA ADS] [CrossRef] [Google Scholar]
- Wegner, W. 2006, MNRAS, 371, 185 [NASA ADS] [CrossRef] [Google Scholar]
- Weis, K. 2003, A&A, 408, 205 [NASA ADS] [CrossRef] [EDP Sciences] [Google Scholar]
- Wellstein, S., & Langer, N. 1999, A&A, 350, 148 [NASA ADS] [Google Scholar]
- Wellstein, S., Langer, N., & Braun, H. 2001, A&A, 369, 939 [NASA ADS] [CrossRef] [EDP Sciences] [Google Scholar]
- Wenger, M., Oberto, A., & Bonnarel, F. 2007, ASP Conf. Ser., 377, 197 [NASA ADS] [Google Scholar]
- Williams, J. P., & Cieza, L. A. 2011, ARA&A, 49, 67 [NASA ADS] [CrossRef] [Google Scholar]
- Wood, P. R., Olivier, E. A., & Kawaler, S. D. 2004, ApJ, 604, 800 [NASA ADS] [CrossRef] [Google Scholar]
- Wright, E. L., Eisenhardt, P. R. M., Mainzer, A. K., et al. 2010, AJ, 140, 1868 [NASA ADS] [CrossRef] [Google Scholar]
- Yoon, S.-C., Woosley, S. E., & Langer, N. 2010, ApJ, 725, 940 [NASA ADS] [CrossRef] [Google Scholar]
- Zahn, J. P. 1975, A&A, 41, 329 [NASA ADS] [Google Scholar]
- Zhang, F., Li, X. D., & Wang, Z. R. 2003, ApJ, 603, 663 [NASA ADS] [CrossRef] [Google Scholar]
- Zorec, J., & Briot, D. 1997, A&A, 318, 443 [NASA ADS] [Google Scholar]
Appendix A: Physical extent of bow shocks and centered nebulae
We compare the apex distances of bow shocks in pc with the radii of centered nebulae in pc calculated from their physical size (see Table B.2), assuming that all centered nebulae are circular. We carry out a Kuiper test in order to investigate whether the underlying distributions are similar or significantly different from each other. We find that the probability that the two distributions are similar is 5%, that is, 2σ.
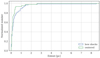 |
Fig. A.1. Normalized cumulative distribution of apex distances of bow shocks (blue) and radii of centered nebulae (green, assuming that all of them are spherical symmetric). |
Appendix B:
Database
Compilation of all parameter values from the literature.
Overview over all the measured and calculated parameters.
All Tables
Classification scheme based on the shape of the nebulae associated with BSC stars, the misalignment angle α, and the spatial offset between the star and the nebula.
All Figures
|
Fig. 1. Representative examples for each morphological group. From left to right: aligned bow shocks, unaligned bow shocks, and centered, unresolved, and not classified nebulae. All images are RGB images where red, green, and blue correspond to the WISE 22, 12, and 4.6 μm filters. The straight white lines show the proper motion corrected to the local standard of rest. Their length indicates the displacement of each star within 10 000 yr. The white bar at the bottom of each panel corresponds to 2′. |
| In the text | |
|
Fig. 2. Sketch of the possible misclassification paths between the defined morphology groups. |
| In the text | |
|
Fig. 3. Associations of different morphology groups with spectral types. Because of their low numbers, O and A stars are not divided into subtypes. The fractions are given with respect to the total number of stars of the respective spectral type in the BSC. |
| In the text | |
|
Fig. 4. Distribution of all O, B, and A stars in the BSC over the sky (gray dots, transparent for better visibility). The BSC stars associated with different morphological types of IR nebulae are identified with the symbols explained in the legend. The Ophiuchus star-forming region is marked by a circle. |
| In the text | |
|
Fig. 5. Distribution of space velocities of the BSC stars calculated from Eq. (1). The colors correspond to the different morphological groups as indicated in the legend. |
| In the text | |
|
Fig. A.1. Normalized cumulative distribution of apex distances of bow shocks (blue) and radii of centered nebulae (green, assuming that all of them are spherical symmetric). |
| In the text | |
Current usage metrics show cumulative count of Article Views (full-text article views including HTML views, PDF and ePub downloads, according to the available data) and Abstracts Views on Vision4Press platform.
Data correspond to usage on the plateform after 2015. The current usage metrics is available 48-96 hours after online publication and is updated daily on week days.
Initial download of the metrics may take a while.