Fig. 4.
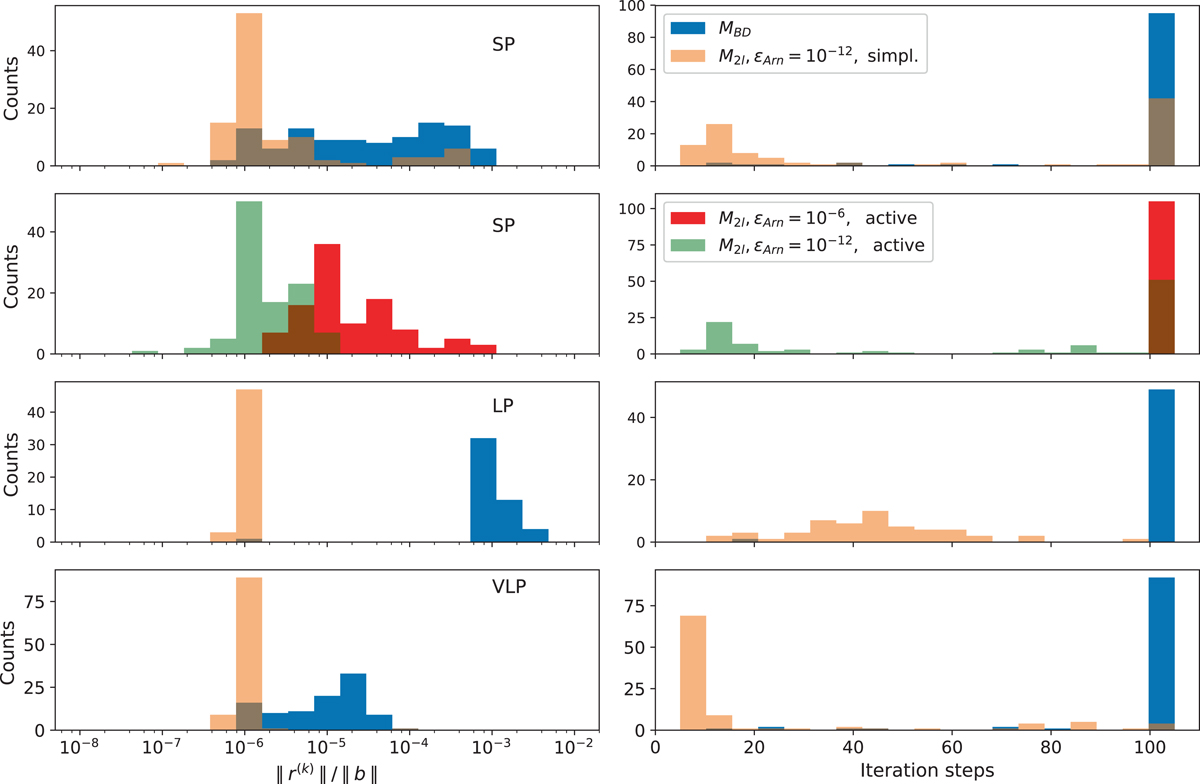
Histograms of (left) residual norms and (right) iteration steps of PCG runs performed on simulated data on SP, LP, and VLP in the top, centre, and bottom panels, respectively. Blue and orange bars show the histogram related to PCG runs with MBD and with M2l applied with the simplified approach, respectively. In the top panel we also show PCG runs applied with the active approach with ϵArn = 10−6 (10−12) as red (green) bars.
Current usage metrics show cumulative count of Article Views (full-text article views including HTML views, PDF and ePub downloads, according to the available data) and Abstracts Views on Vision4Press platform.
Data correspond to usage on the plateform after 2015. The current usage metrics is available 48-96 hours after online publication and is updated daily on week days.
Initial download of the metrics may take a while.