Fig. 3
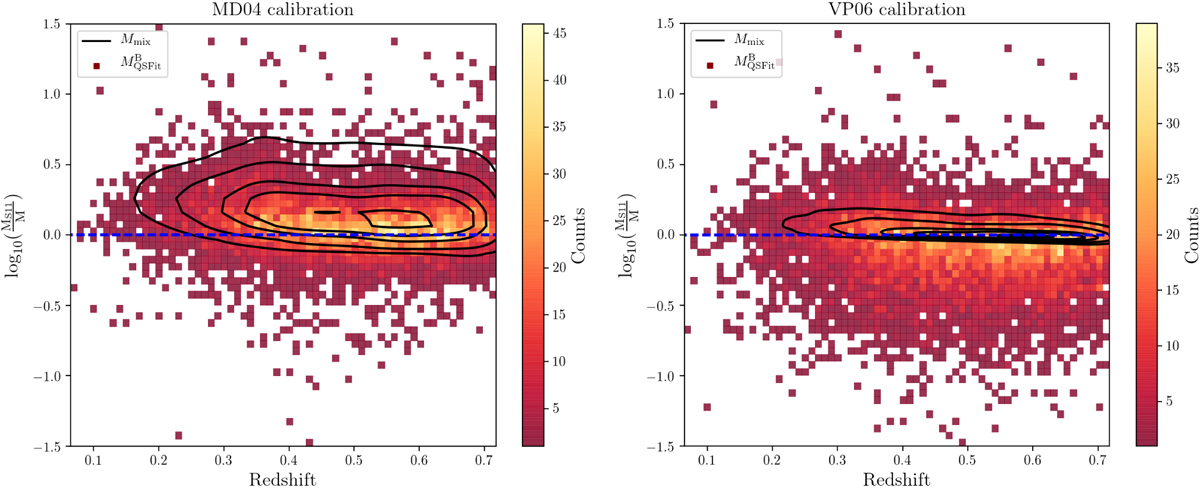
Ratio of virial masses of S11 and this work as a function of redshift. The color-coded two-dimensional histogram refers to ratios in which the MBH virial masses![]() have been obtained directly from the QSFIT results from Eq. (2) (left panel) and Eq. (3) (right panel). The redshift is binned with a step of 0.01, while the S11-QSFIT mass ratio is binned with a bin step of 0.05. The locus of the ratios obtained using Mmix as denominator is mapped with the density contours, which are drawn at 10%, 25%, 50%, 68% and 95% of the distribution; with Mmix being the MBH mass calculated using S11 FWHM and our AGN continuum luminosity. For each calibration the blue dashed line shows the equivalence between our mass estimate and MS11.
have been obtained directly from the QSFIT results from Eq. (2) (left panel) and Eq. (3) (right panel). The redshift is binned with a step of 0.01, while the S11-QSFIT mass ratio is binned with a bin step of 0.05. The locus of the ratios obtained using Mmix as denominator is mapped with the density contours, which are drawn at 10%, 25%, 50%, 68% and 95% of the distribution; with Mmix being the MBH mass calculated using S11 FWHM and our AGN continuum luminosity. For each calibration the blue dashed line shows the equivalence between our mass estimate and MS11.
Current usage metrics show cumulative count of Article Views (full-text article views including HTML views, PDF and ePub downloads, according to the available data) and Abstracts Views on Vision4Press platform.
Data correspond to usage on the plateform after 2015. The current usage metrics is available 48-96 hours after online publication and is updated daily on week days.
Initial download of the metrics may take a while.