Fig. 2
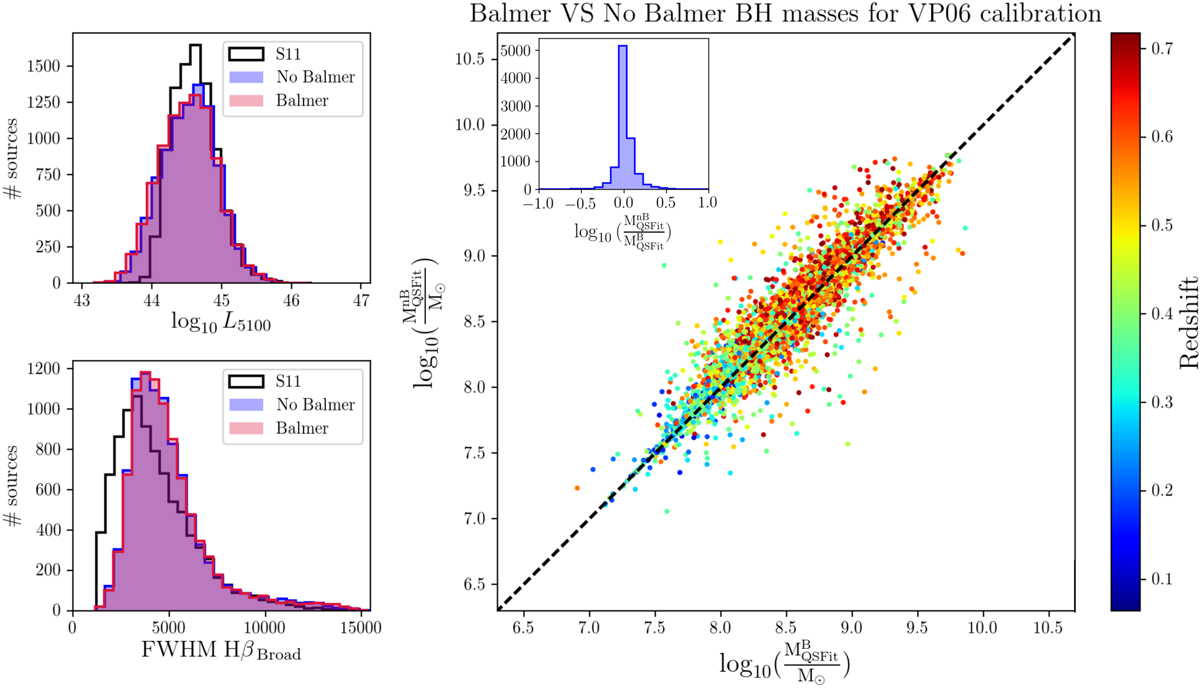
Left panels: distributions of 5100 Å continuum luminosity (upper) and FWHMHβ (lower). Black histograms show results from S11. Red and blue filled histograms are the QSFIT results obtained including and without the Balmer continuum component, respectively. Right panel: comparison between ![]() and
and ![]() . The points are colored in redshift. The dashed black line is the equality line. The blue histogram shows the distribution of the logarithmic ratio between
. The points are colored in redshift. The dashed black line is the equality line. The blue histogram shows the distribution of the logarithmic ratio between
![]() and
and ![]() . The three panels show that results obtained with or without the Balmer continuum component are substantially consistent.
. The three panels show that results obtained with or without the Balmer continuum component are substantially consistent.
Current usage metrics show cumulative count of Article Views (full-text article views including HTML views, PDF and ePub downloads, according to the available data) and Abstracts Views on Vision4Press platform.
Data correspond to usage on the plateform after 2015. The current usage metrics is available 48-96 hours after online publication and is updated daily on week days.
Initial download of the metrics may take a while.