Fig. 1
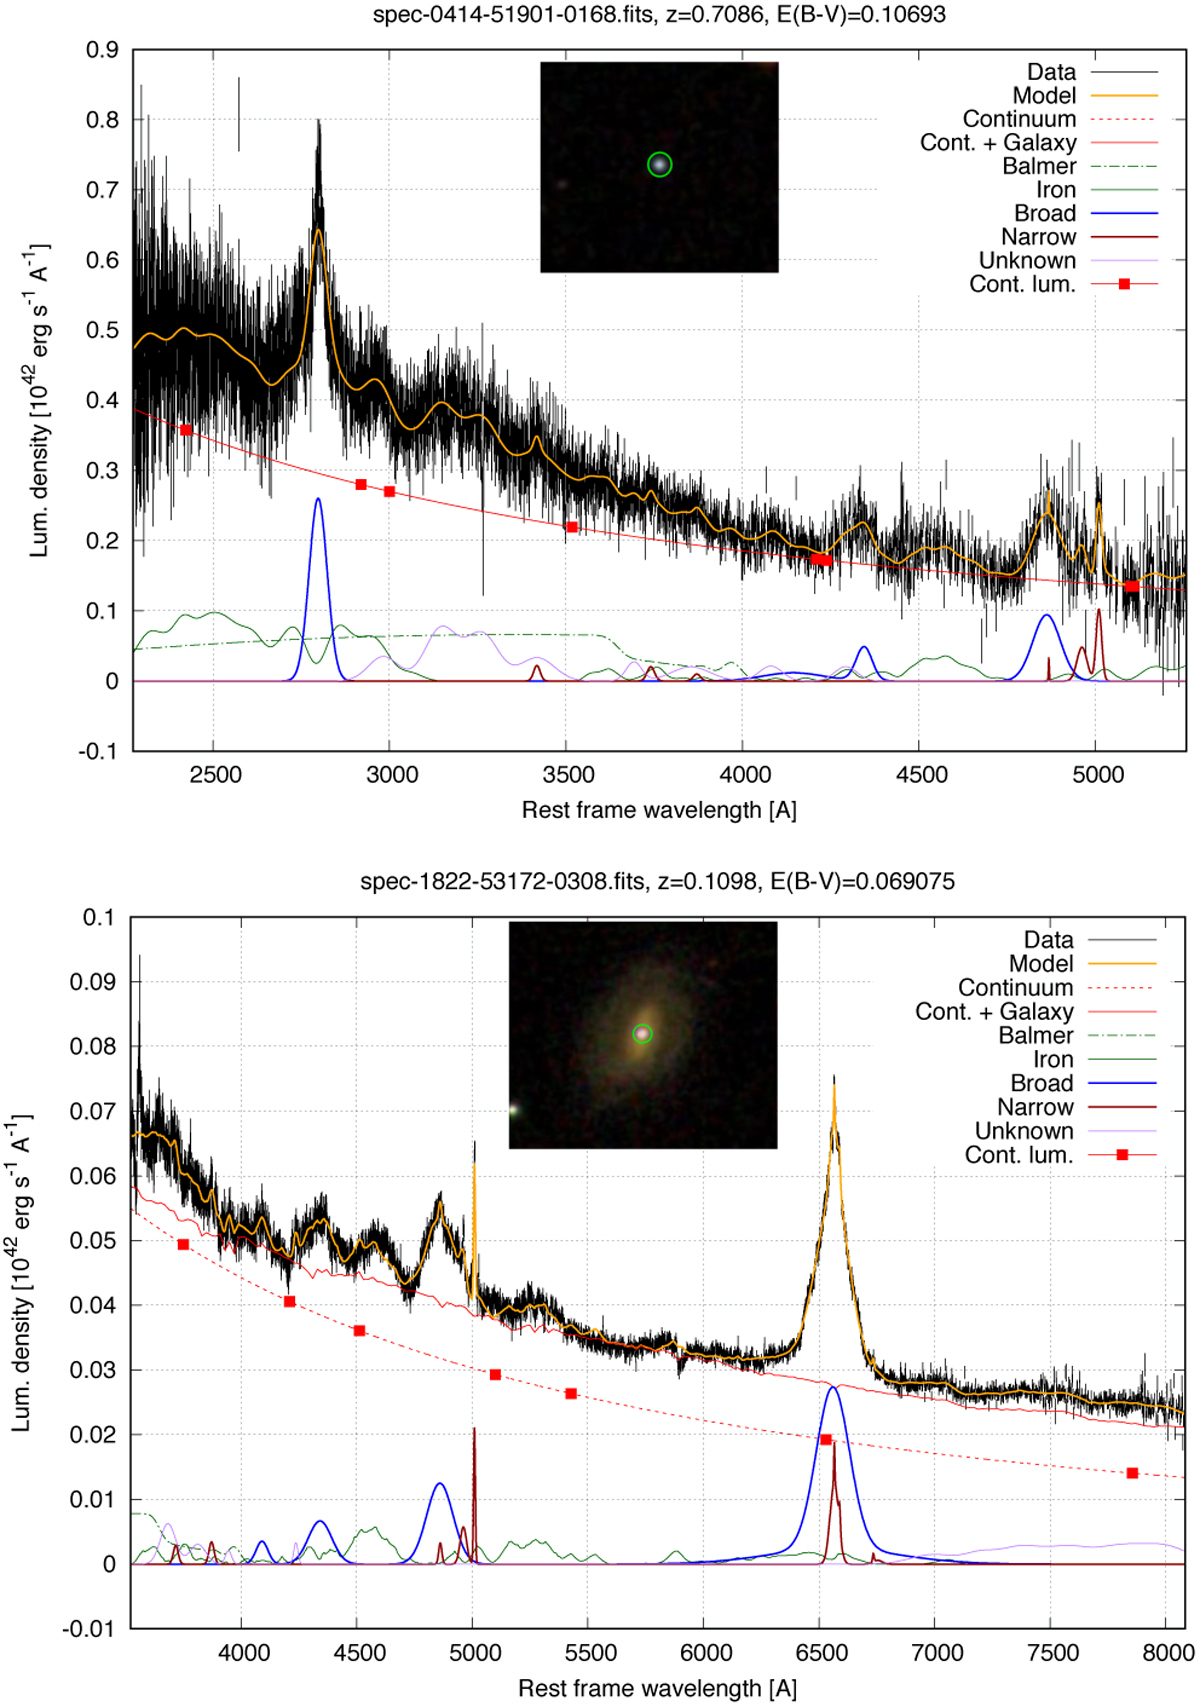
SDSS spectra and images of SDSS J032545.70−000820.6 (z ≃ 0.7; upper panel)and SDSS J155053.16+052112.1 (z ≃ 0.1; lower panel). In each spectrum, SDSS data with respective errors (black lines) are compared with the QSFIT model (orange solid line). The red dashed line is the continuum component, while the red solid line includes both AGN and host galaxy continuum. The dot-dashed green line is the Balmer continuum component; the green solid line is the iron template. Broad emission lines are shown with solid blue lines, while narrow emission lines with solid brown lines. The solid purple line is the sum of all the “unknown” lines. The spatial region from which the SDSS spectra were obtained is shown in the SDSS images with a green circle with a diameter of 3 arcsec. The two sources have significantly different contributions from the host galaxy: this is evident both in the SDSS images and in the spectra. In our fitting procedure we did not fix the FWHM and fluxes ratio of the [OIII] doublet. This affects individual features of the [OIII] doublet, but does not affect the mass estimates.
Current usage metrics show cumulative count of Article Views (full-text article views including HTML views, PDF and ePub downloads, according to the available data) and Abstracts Views on Vision4Press platform.
Data correspond to usage on the plateform after 2015. The current usage metrics is available 48-96 hours after online publication and is updated daily on week days.
Initial download of the metrics may take a while.