Fig. 9
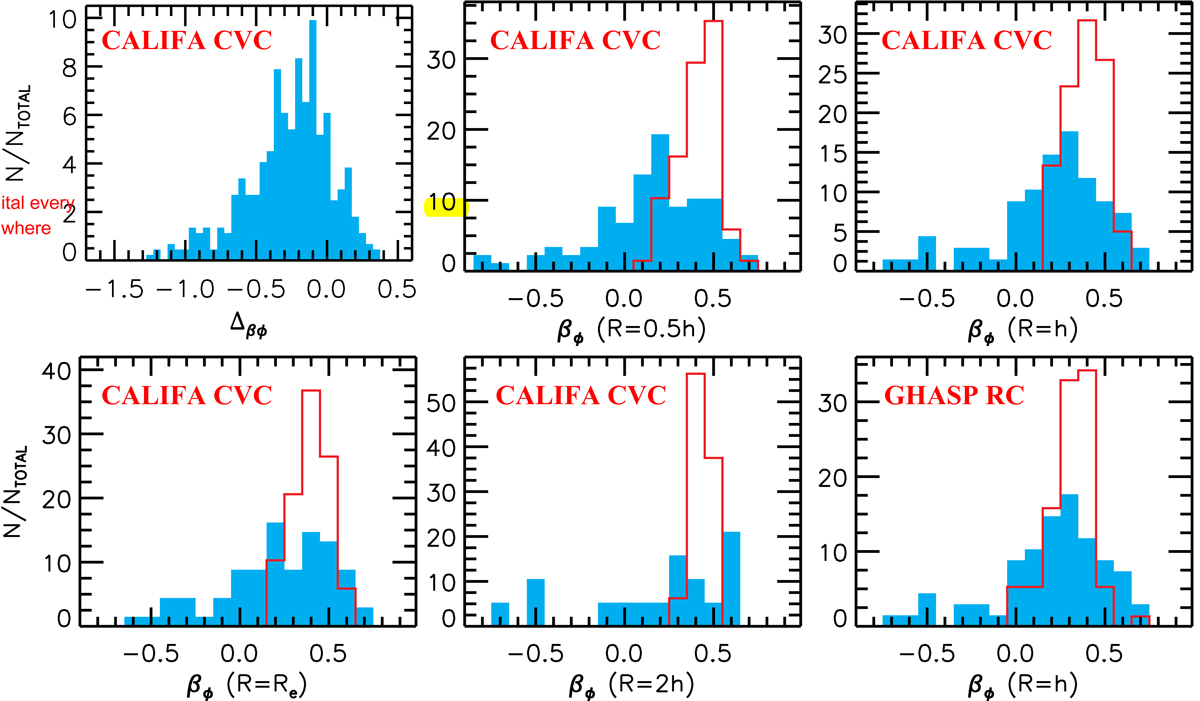
Comparisons of stellar anisotropy βϕ and epicycle anisotropy βEA. All panels show normalized distributions in %. The bottom right panel compares the stellar anisotropy from CALIFA with the epicycle value derived from Hα rotation curves of the GHASP sample of Epinat et al. (2008a,b), while all other panels compare the stellar anisotropy from CALIFA with the epicycle value derived from CALIFA circular velocity curves of Kalinova et al. (2017). The top left graph is the total distribution of differences Δβϕ = βϕ − βEA for the 68 CALIFA galaxies with common βϕ and βEA. Blue shaded histograms are those of the stellar anisotropy, and red histograms those of the epicycle anisotropy.
Current usage metrics show cumulative count of Article Views (full-text article views including HTML views, PDF and ePub downloads, according to the available data) and Abstracts Views on Vision4Press platform.
Data correspond to usage on the plateform after 2015. The current usage metrics is available 48-96 hours after online publication and is updated daily on week days.
Initial download of the metrics may take a while.