Fig. 8
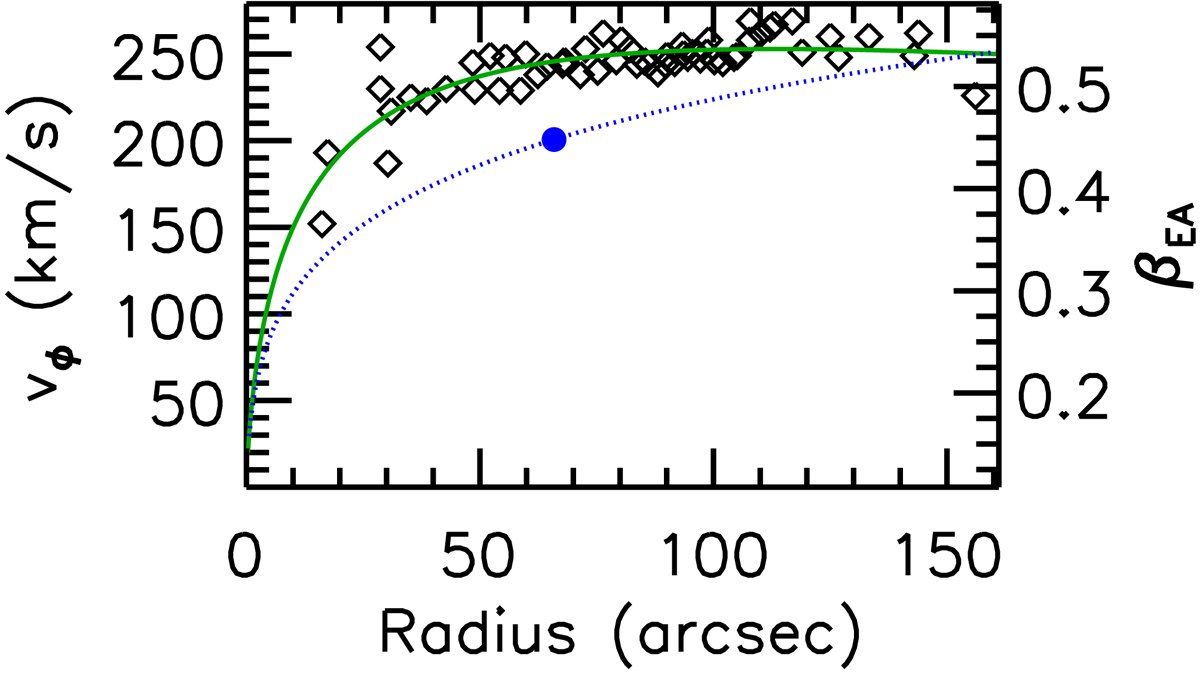
Hα rotation curve (vϕ, open symbols and solid line) and the epicycle anisotropy profile (βEA, dotted line) of the galaxy UGC 3809. The Hα rotation curve is from the GHASP survey (Epinat et al. 2008a,b). The solid line indicates the Einasto model of the rotation velocity. The βEA profile is deduced from the rotation model using Eq. (3). The filled circles represent βEA at R = h.
Current usage metrics show cumulative count of Article Views (full-text article views including HTML views, PDF and ePub downloads, according to the available data) and Abstracts Views on Vision4Press platform.
Data correspond to usage on the plateform after 2015. The current usage metrics is available 48-96 hours after online publication and is updated daily on week days.
Initial download of the metrics may take a while.