Fig. 7
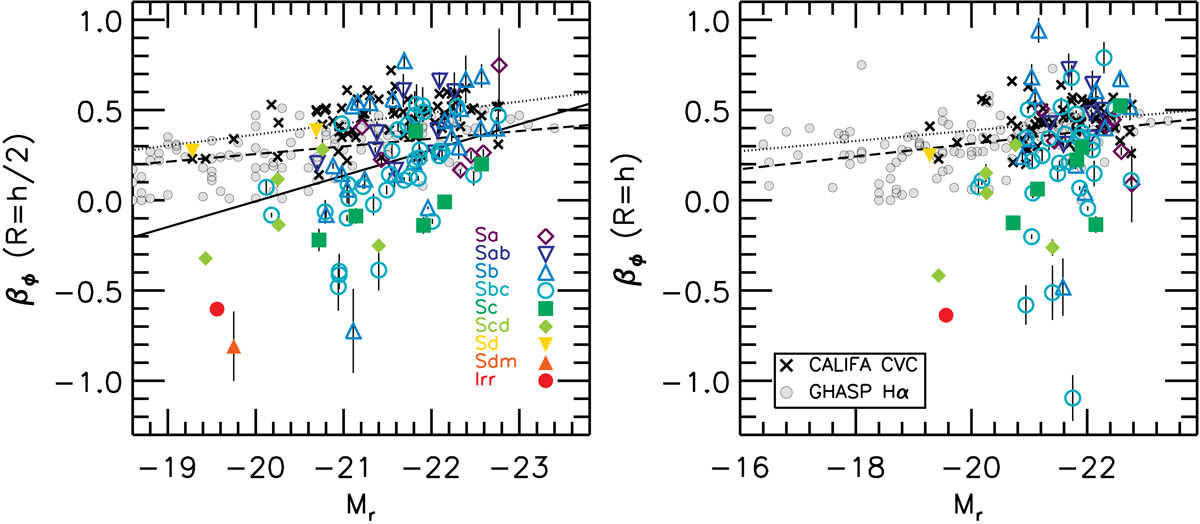
Absolute magnitude-anisotropy relations of CALIFA stellar disks at R = h∕2 (left) and R = h (right). Different colors and symbols represent different disk morphologies from Sa to Irr. The solid line is the most likely linear fit to βϕ (at R = h∕2 only). Crossed symbols and dotted lines represent the observed and best-fit relations predicted by the epicycle approximation for the same CALIFA disks, as deduced from circular velocity curves of Kalinova et al. (2017). Gray circles and dashed lines are the observed and best-fit relations predicted by the epicycle approximation for other galaxies, as deduced from Hα rotation curves of the GHASP sample of Epinat et al. (2008a,b).
Current usage metrics show cumulative count of Article Views (full-text article views including HTML views, PDF and ePub downloads, according to the available data) and Abstracts Views on Vision4Press platform.
Data correspond to usage on the plateform after 2015. The current usage metrics is available 48-96 hours after online publication and is updated daily on week days.
Initial download of the metrics may take a while.