Fig. 4
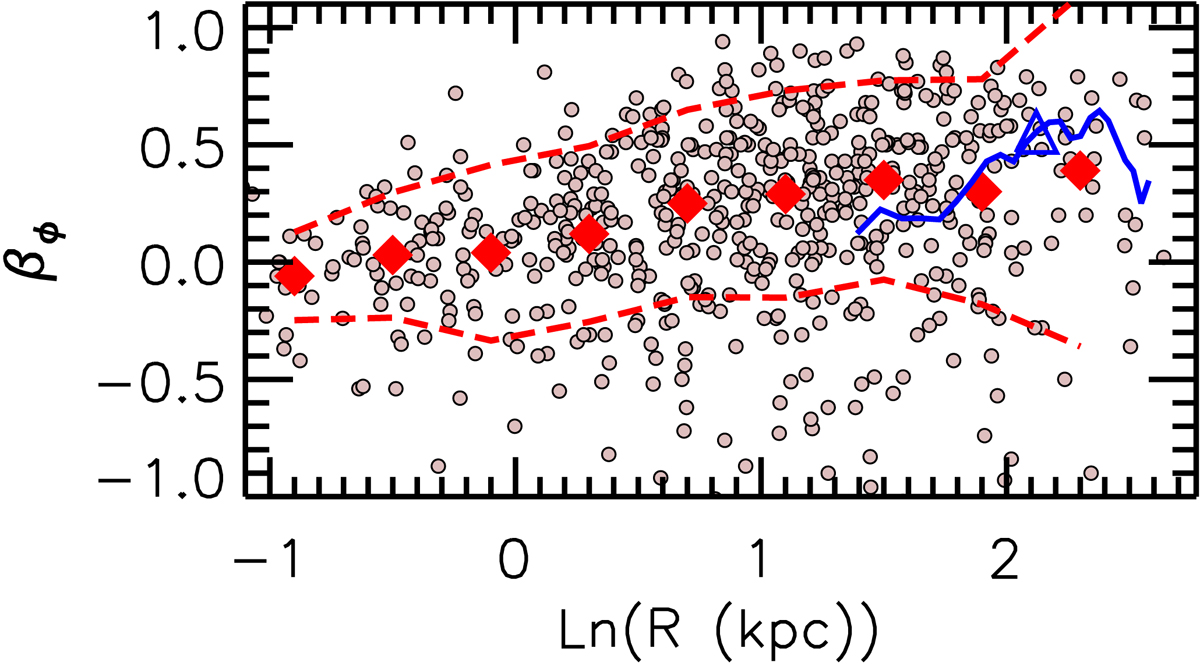
Azimuthal anisotropy profiles for the sample of 93 CALIFA disk galaxies(circles).The filled diamonds represent the median profile derived from every galaxy and the dashed lines the standard deviation. The solid line indicates the anisotropy profile oftheMilkyWayasdeducedfromGaiaDataRelease2dispersions published in Gaia Collaboration (2018b), and an open triangle the location of the Sun.
Current usage metrics show cumulative count of Article Views (full-text article views including HTML views, PDF and ePub downloads, according to the available data) and Abstracts Views on Vision4Press platform.
Data correspond to usage on the plateform after 2015. The current usage metrics is available 48-96 hours after online publication and is updated daily on week days.
Initial download of the metrics may take a while.