Fig. 2
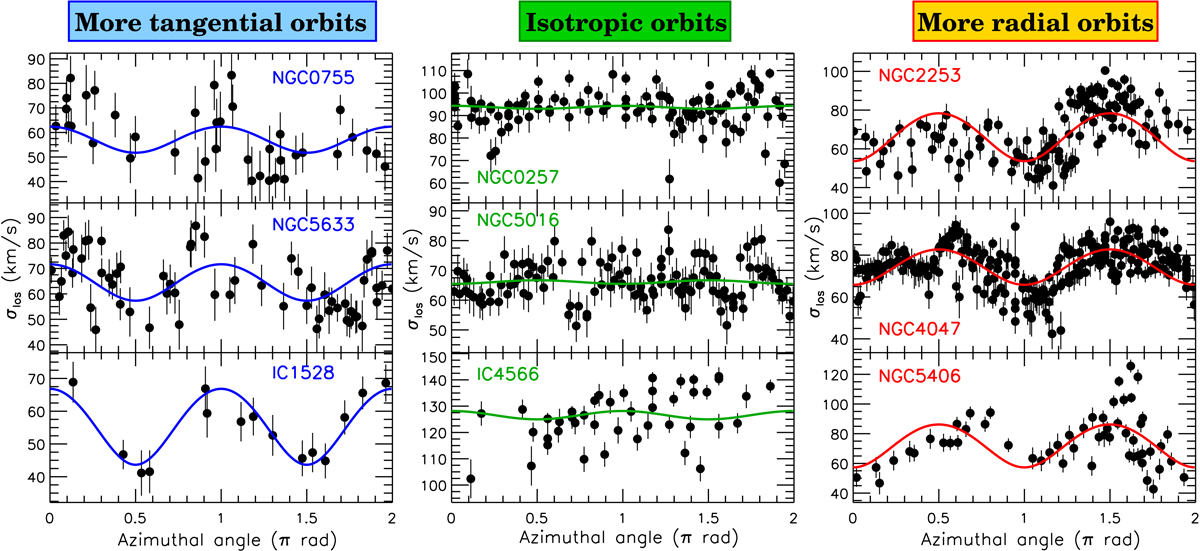
Azimuth-velocity dispersion diagrams for 9 example galaxies. From left to right (respectively) the columns illustrate orbits that are more tangentially biased (βϕ → − 0.5), isotropic (βϕ ∼ 0), and more radially biased (βϕ → 0.5). Symbols are the CALIFA line-of-sight velocity dispersions and colored curves the best-fit anisotropic dispersion model (for the case ![]() ). See text for information about the considered radial range of the diagrams.
). See text for information about the considered radial range of the diagrams.
Current usage metrics show cumulative count of Article Views (full-text article views including HTML views, PDF and ePub downloads, according to the available data) and Abstracts Views on Vision4Press platform.
Data correspond to usage on the plateform after 2015. The current usage metrics is available 48-96 hours after online publication and is updated daily on week days.
Initial download of the metrics may take a while.