Fig. A.8
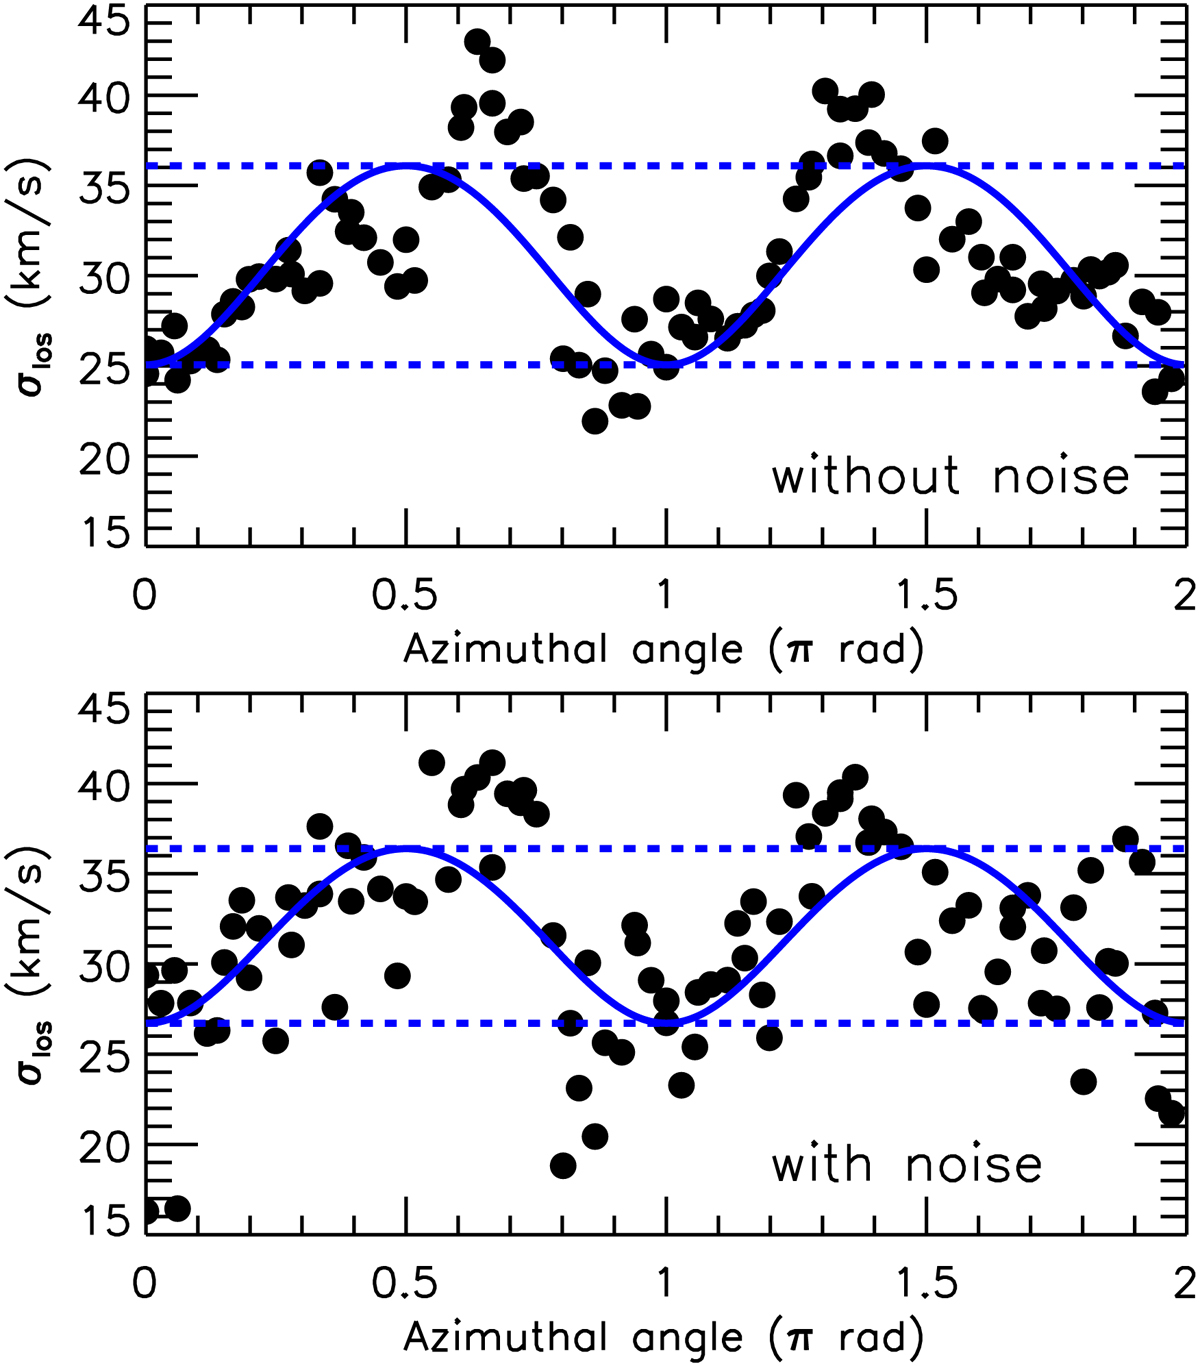
Azimuth-velocity dispersion diagram (low-resolution case). The top and bottom panels delineate the noise-free and noisy models, respectively. The symbols indicate the mock dispersions, and the solid lines the resulting model fitted to the mock values. The selected radial range is 12 ≤ R ≤ 14 kpc. The dashed lines highlight two extreme models of isotropic orbits, which cannot represent the intrinsinc radially biased orbits at the considered radii.
Current usage metrics show cumulative count of Article Views (full-text article views including HTML views, PDF and ePub downloads, according to the available data) and Abstracts Views on Vision4Press platform.
Data correspond to usage on the plateform after 2015. The current usage metrics is available 48-96 hours after online publication and is updated daily on week days.
Initial download of the metrics may take a while.