Free Access
Fig. A.6
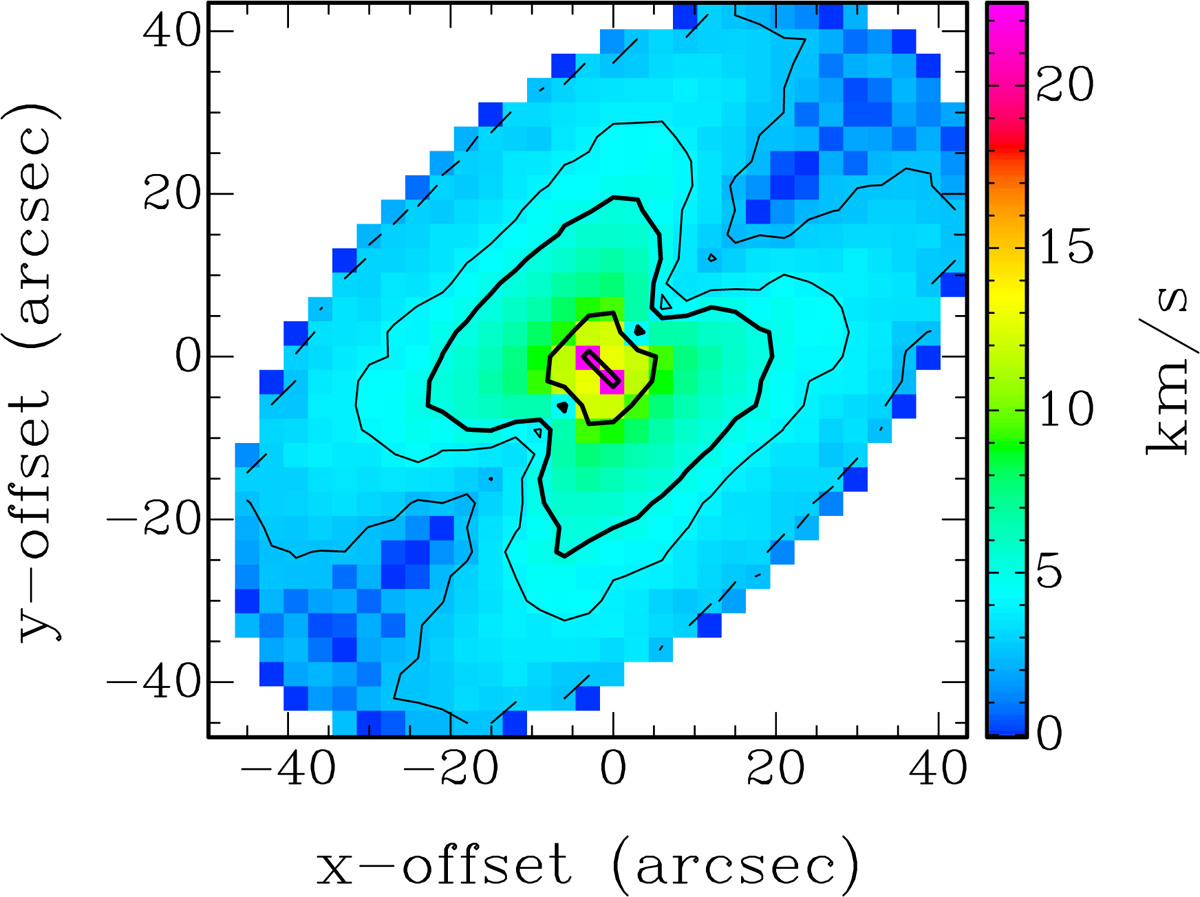
Dispersion pattern in the i = 55° mock dispersion velocity field caused by the effect of viewing the rotation curve at a low resolution of ∼ 1 kpc. Contours represent σlos = 2.5, 4, 5, 10, and 20 km s− 1.
Current usage metrics show cumulative count of Article Views (full-text article views including HTML views, PDF and ePub downloads, according to the available data) and Abstracts Views on Vision4Press platform.
Data correspond to usage on the plateform after 2015. The current usage metrics is available 48-96 hours after online publication and is updated daily on week days.
Initial download of the metrics may take a while.