Fig. A.1
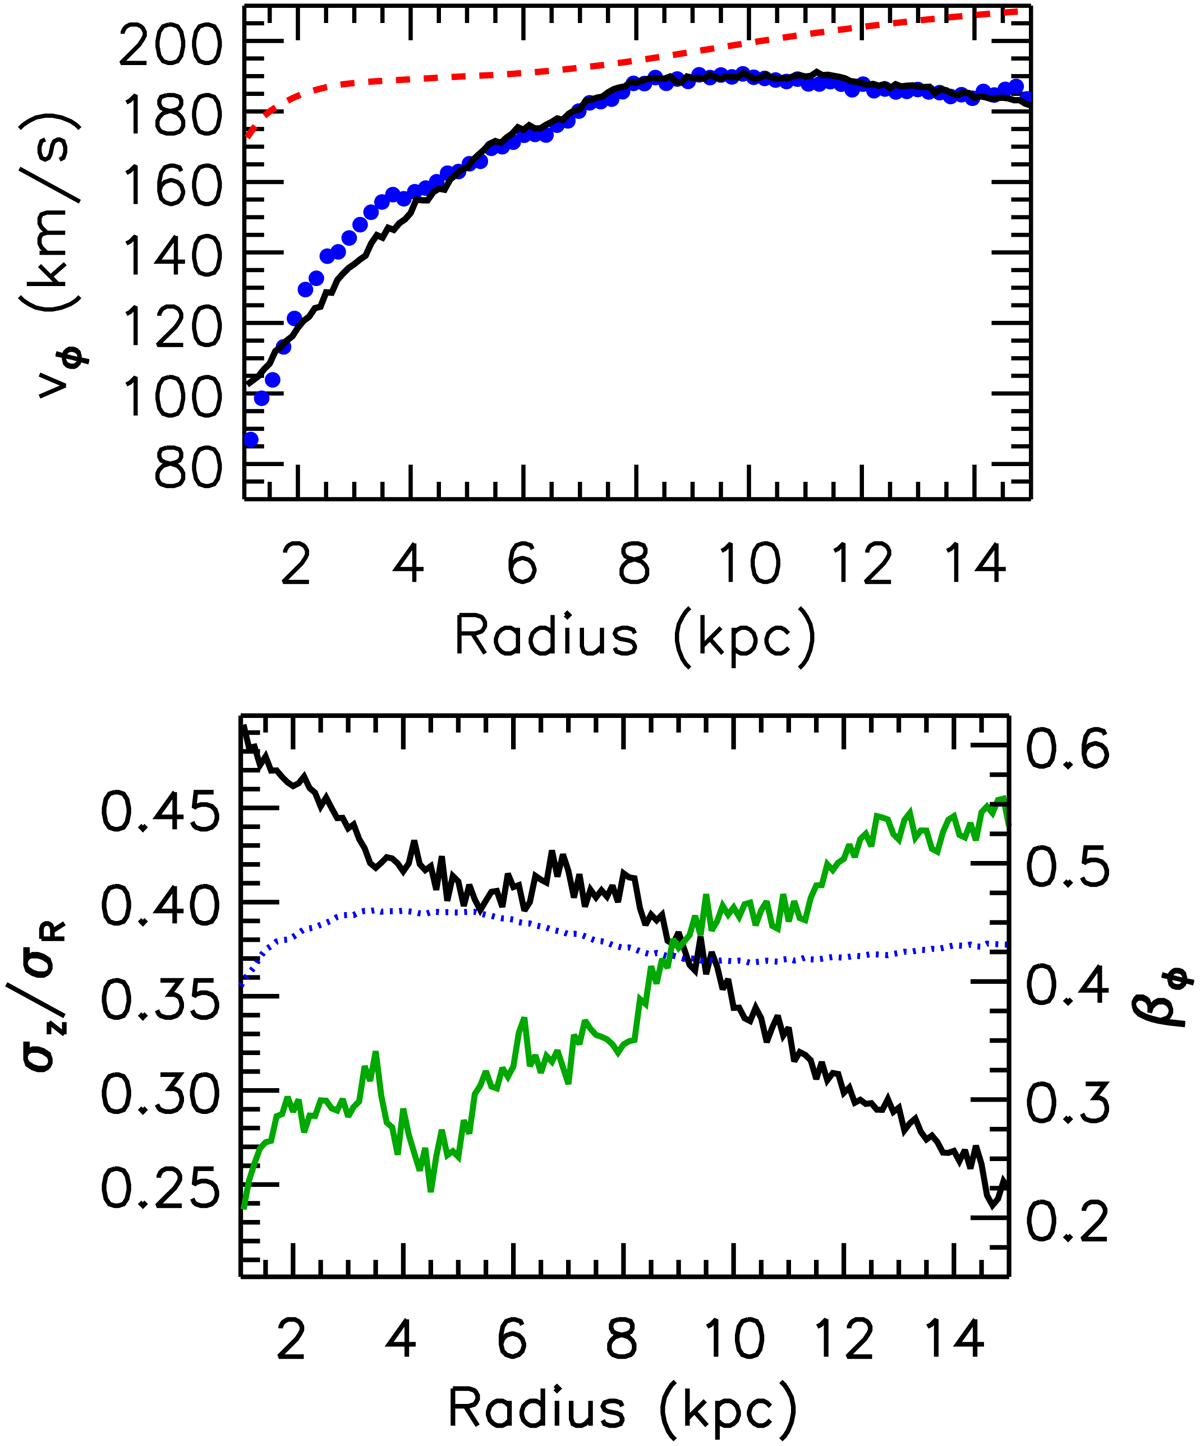
Top: rotation velocity curve of the simulated disk (solid black line). Filled blue symbols represent the rotation curve derived from the high-resolution mock velocity field (i = 55°, see Fig. A.3 and text). The red line indicates the circular velocity curve of the simulation. Bottom: vertical-to-radial dispersion ratio (black line) and azimuthal anisotropy (green line) of the simulated disk. The dotted line indicates the azimuthal anisotropy profile predicted by Eq. (3) of the epicyclic approximation using the circular velocity curve of the simulation.
Current usage metrics show cumulative count of Article Views (full-text article views including HTML views, PDF and ePub downloads, according to the available data) and Abstracts Views on Vision4Press platform.
Data correspond to usage on the plateform after 2015. The current usage metrics is available 48-96 hours after online publication and is updated daily on week days.
Initial download of the metrics may take a while.