Fig. 11
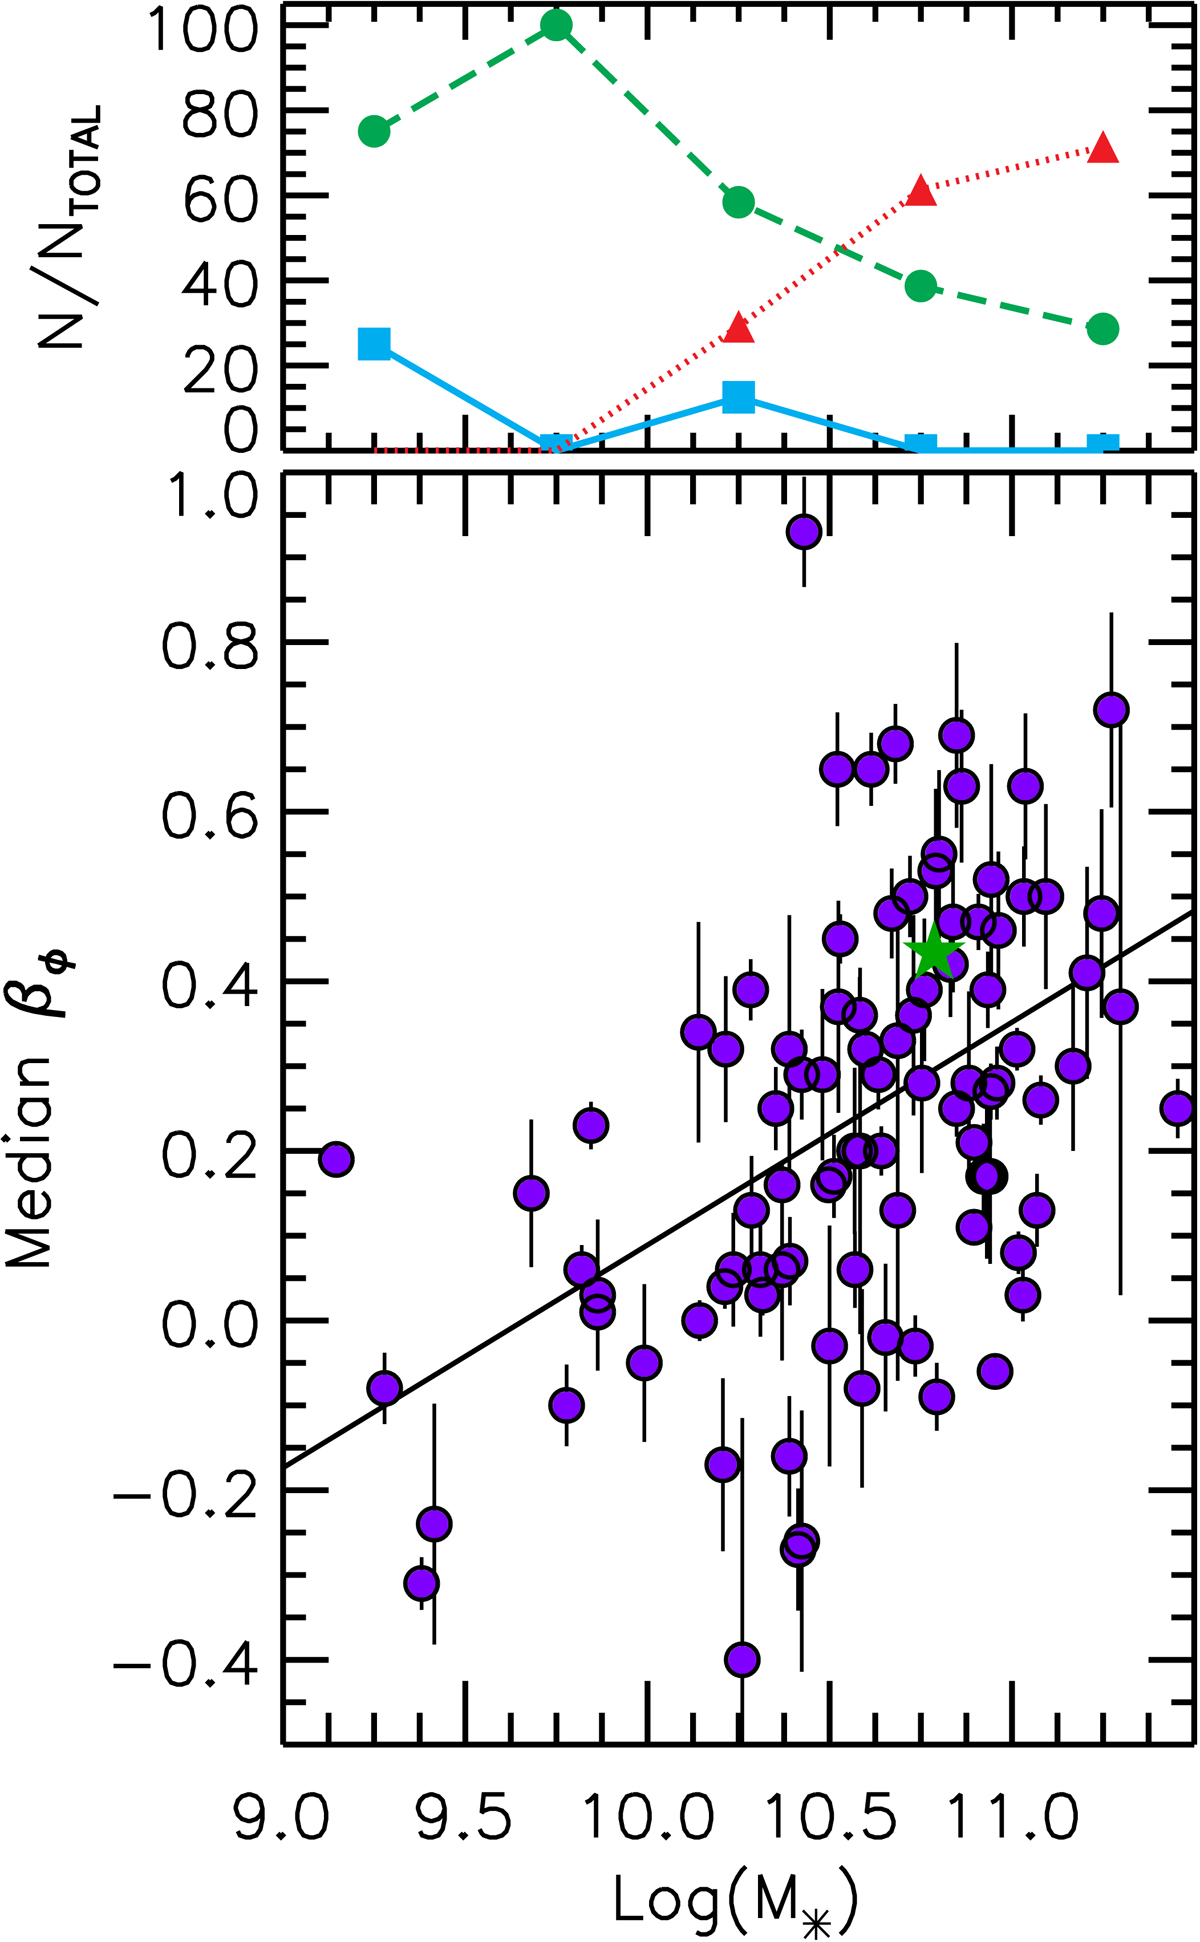
Stellar mass-azimuthal anisotropy correlation. The top panel shows the occurrence of galaxies per bin of stellar mass with isotropic, radial and tangential orbits (circle, triangle, and squared symbols, respectively), normalized to the total number of galaxies per 0.5 dex bin of stellar mass. The mass unit is M⊙. The starred symbol is for the Milky Way. The solid line is the most likely linear model of the mass-anisotropy relation given by Eq. (6).
Current usage metrics show cumulative count of Article Views (full-text article views including HTML views, PDF and ePub downloads, according to the available data) and Abstracts Views on Vision4Press platform.
Data correspond to usage on the plateform after 2015. The current usage metrics is available 48-96 hours after online publication and is updated daily on week days.
Initial download of the metrics may take a while.