Fig. 1
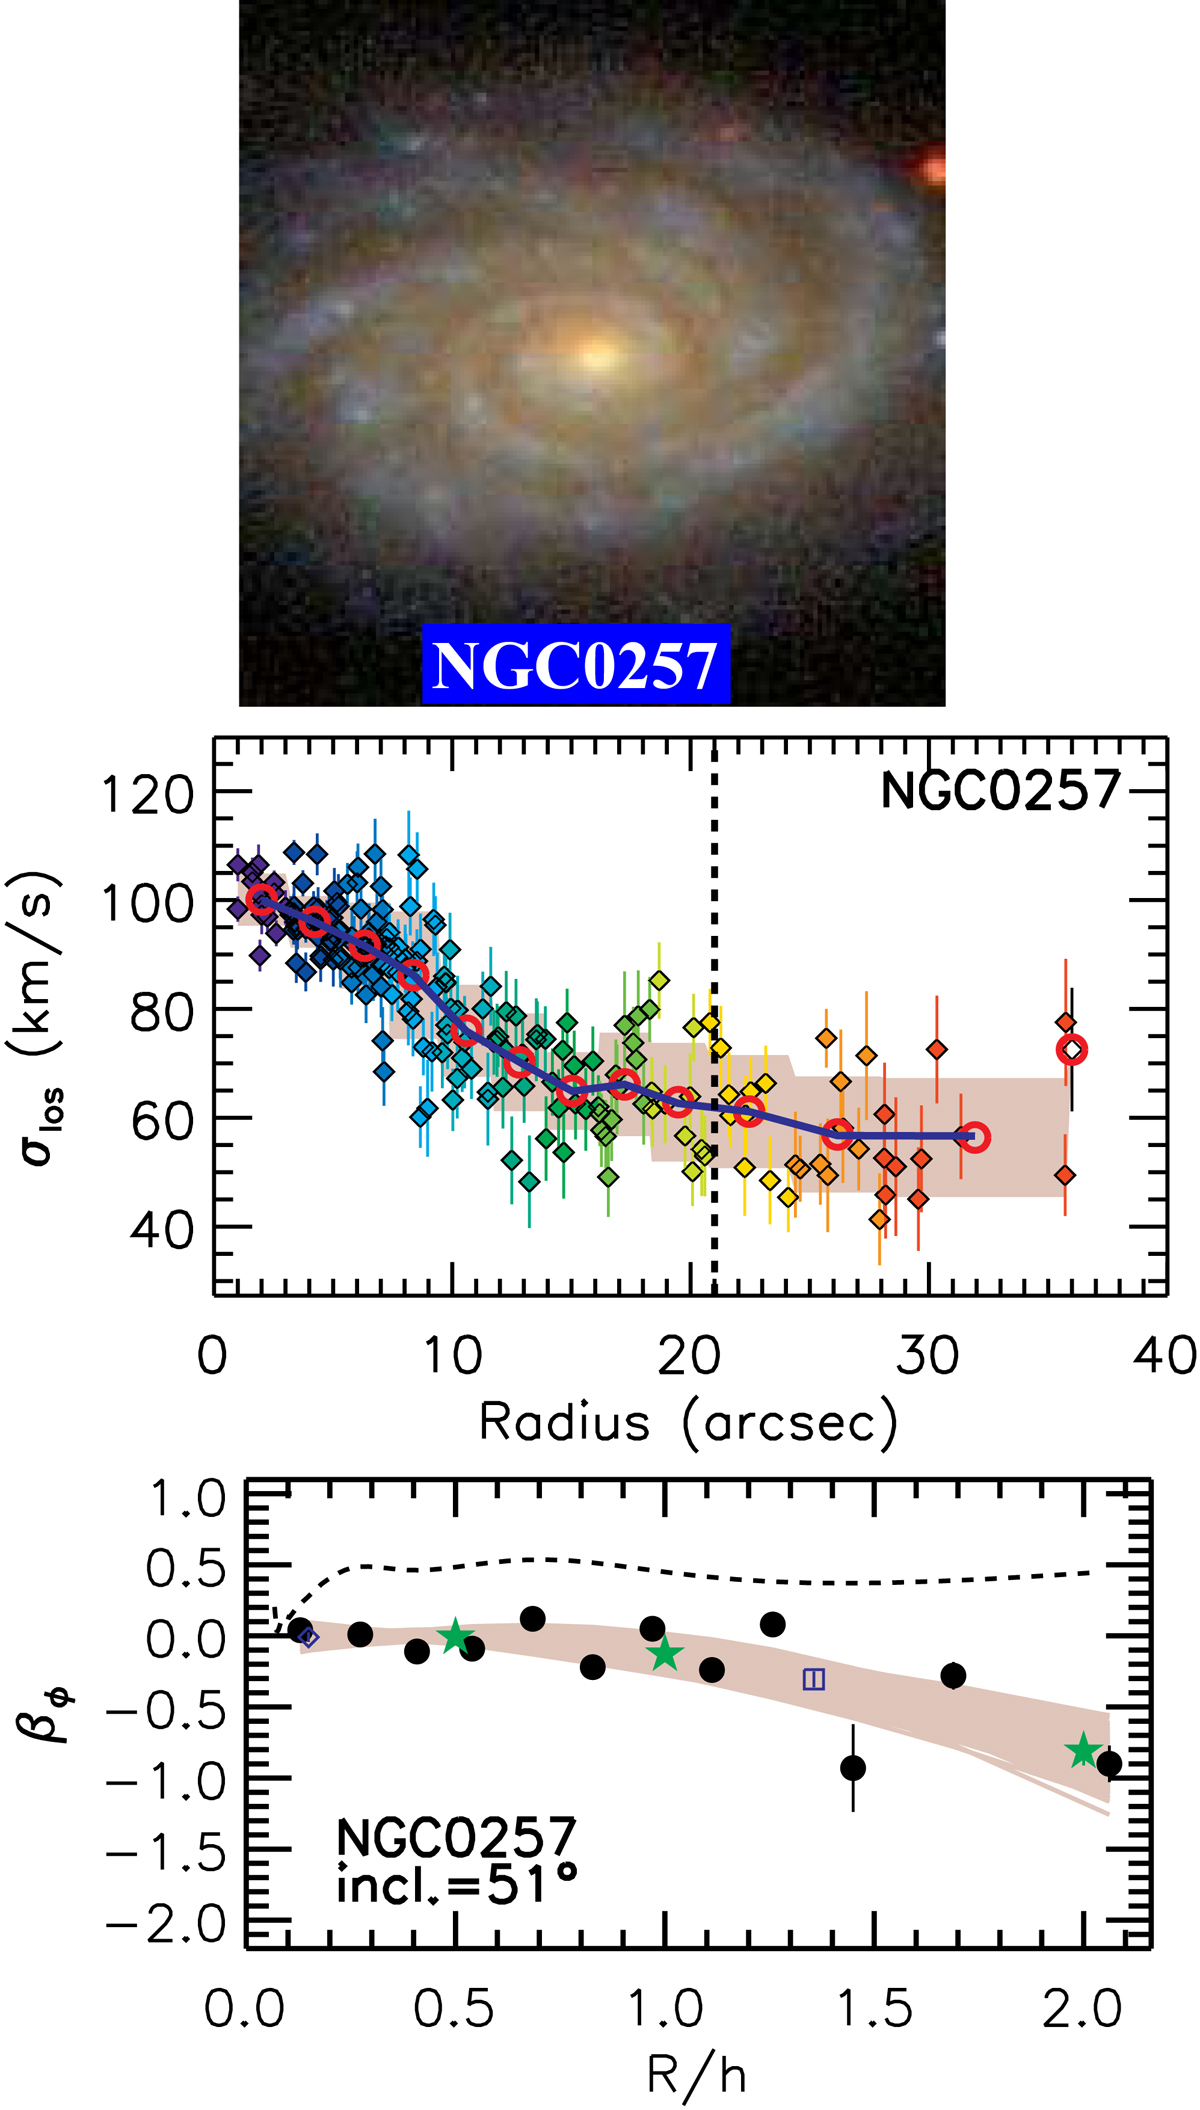
Example of results with the galaxy NGC 257. Top: composite SDSS image of the galaxy. Middle: line-of-sight dispersion profile. A rainbow color code is used to highlight the common spaxel centroids inside the adaptive radial rings. The shaded area represents the standard deviation of σlos inside each adaptive ring. Red open circles represent the azimuthally average of σlos within each radial ring. The thick blue line indicates the azimuthally average of the dispersion model done with ![]() . The vertical dashed line shows the radius R = Re. The last spaxel is not part of any ring and is not used in the modeling of the dispersion ellipsoid. Bottom: profile of azimuthal anisotropy parameter (filled circles) and polynomial fits to the profile (shaded area, see text for details). Starred symbols indicate the values interpolated at R∕h = 0.5, 1, 2 (from the polynomial fits), open diamond and squares at the effective radii of the bulge (R = Rb) and of the galaxy (R = Re). A dashed line indicates the azimuthal anisotropy expected by the epicyclic approximation from the circular velocity curve of the galaxy.
. The vertical dashed line shows the radius R = Re. The last spaxel is not part of any ring and is not used in the modeling of the dispersion ellipsoid. Bottom: profile of azimuthal anisotropy parameter (filled circles) and polynomial fits to the profile (shaded area, see text for details). Starred symbols indicate the values interpolated at R∕h = 0.5, 1, 2 (from the polynomial fits), open diamond and squares at the effective radii of the bulge (R = Rb) and of the galaxy (R = Re). A dashed line indicates the azimuthal anisotropy expected by the epicyclic approximation from the circular velocity curve of the galaxy.
Current usage metrics show cumulative count of Article Views (full-text article views including HTML views, PDF and ePub downloads, according to the available data) and Abstracts Views on Vision4Press platform.
Data correspond to usage on the plateform after 2015. The current usage metrics is available 48-96 hours after online publication and is updated daily on week days.
Initial download of the metrics may take a while.