Fig. 9.
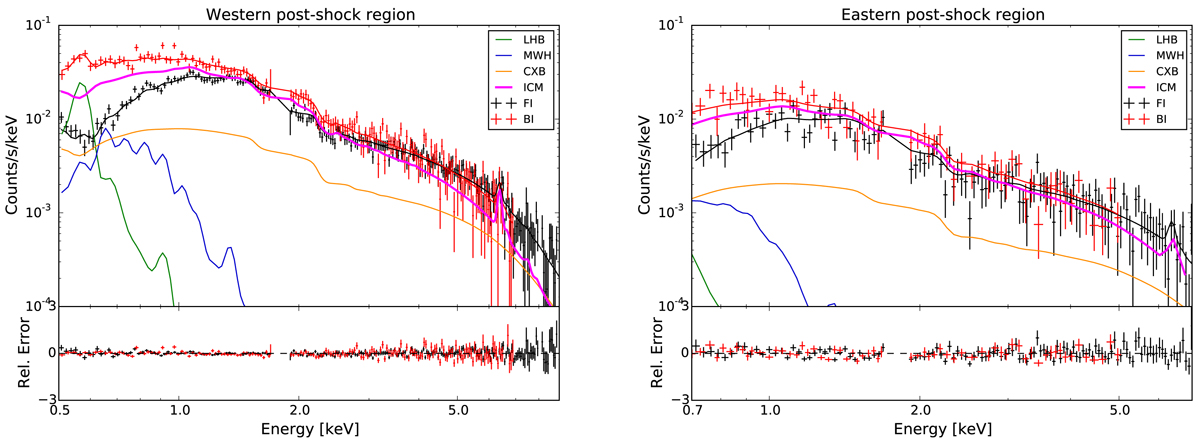
Left: NXB-subtracted spectrum of western post-shock region in the 0.5–10 keV band. Right: eastern post-shock spectrum in the 0.7–7.0 keV band. The FI (black) and BI (red) spectra are fitted with the ICM model together with the CXB and Galactic emission. The ICM is shown in magenta. The LHB, MWH and CXB are represented by green, blue and orange curves, respectively. The ICM, LHB, MWH, and CXB has been represented relative to the BI spectrum.
Current usage metrics show cumulative count of Article Views (full-text article views including HTML views, PDF and ePub downloads, according to the available data) and Abstracts Views on Vision4Press platform.
Data correspond to usage on the plateform after 2015. The current usage metrics is available 48-96 hours after online publication and is updated daily on week days.
Initial download of the metrics may take a while.