Fig. 8.
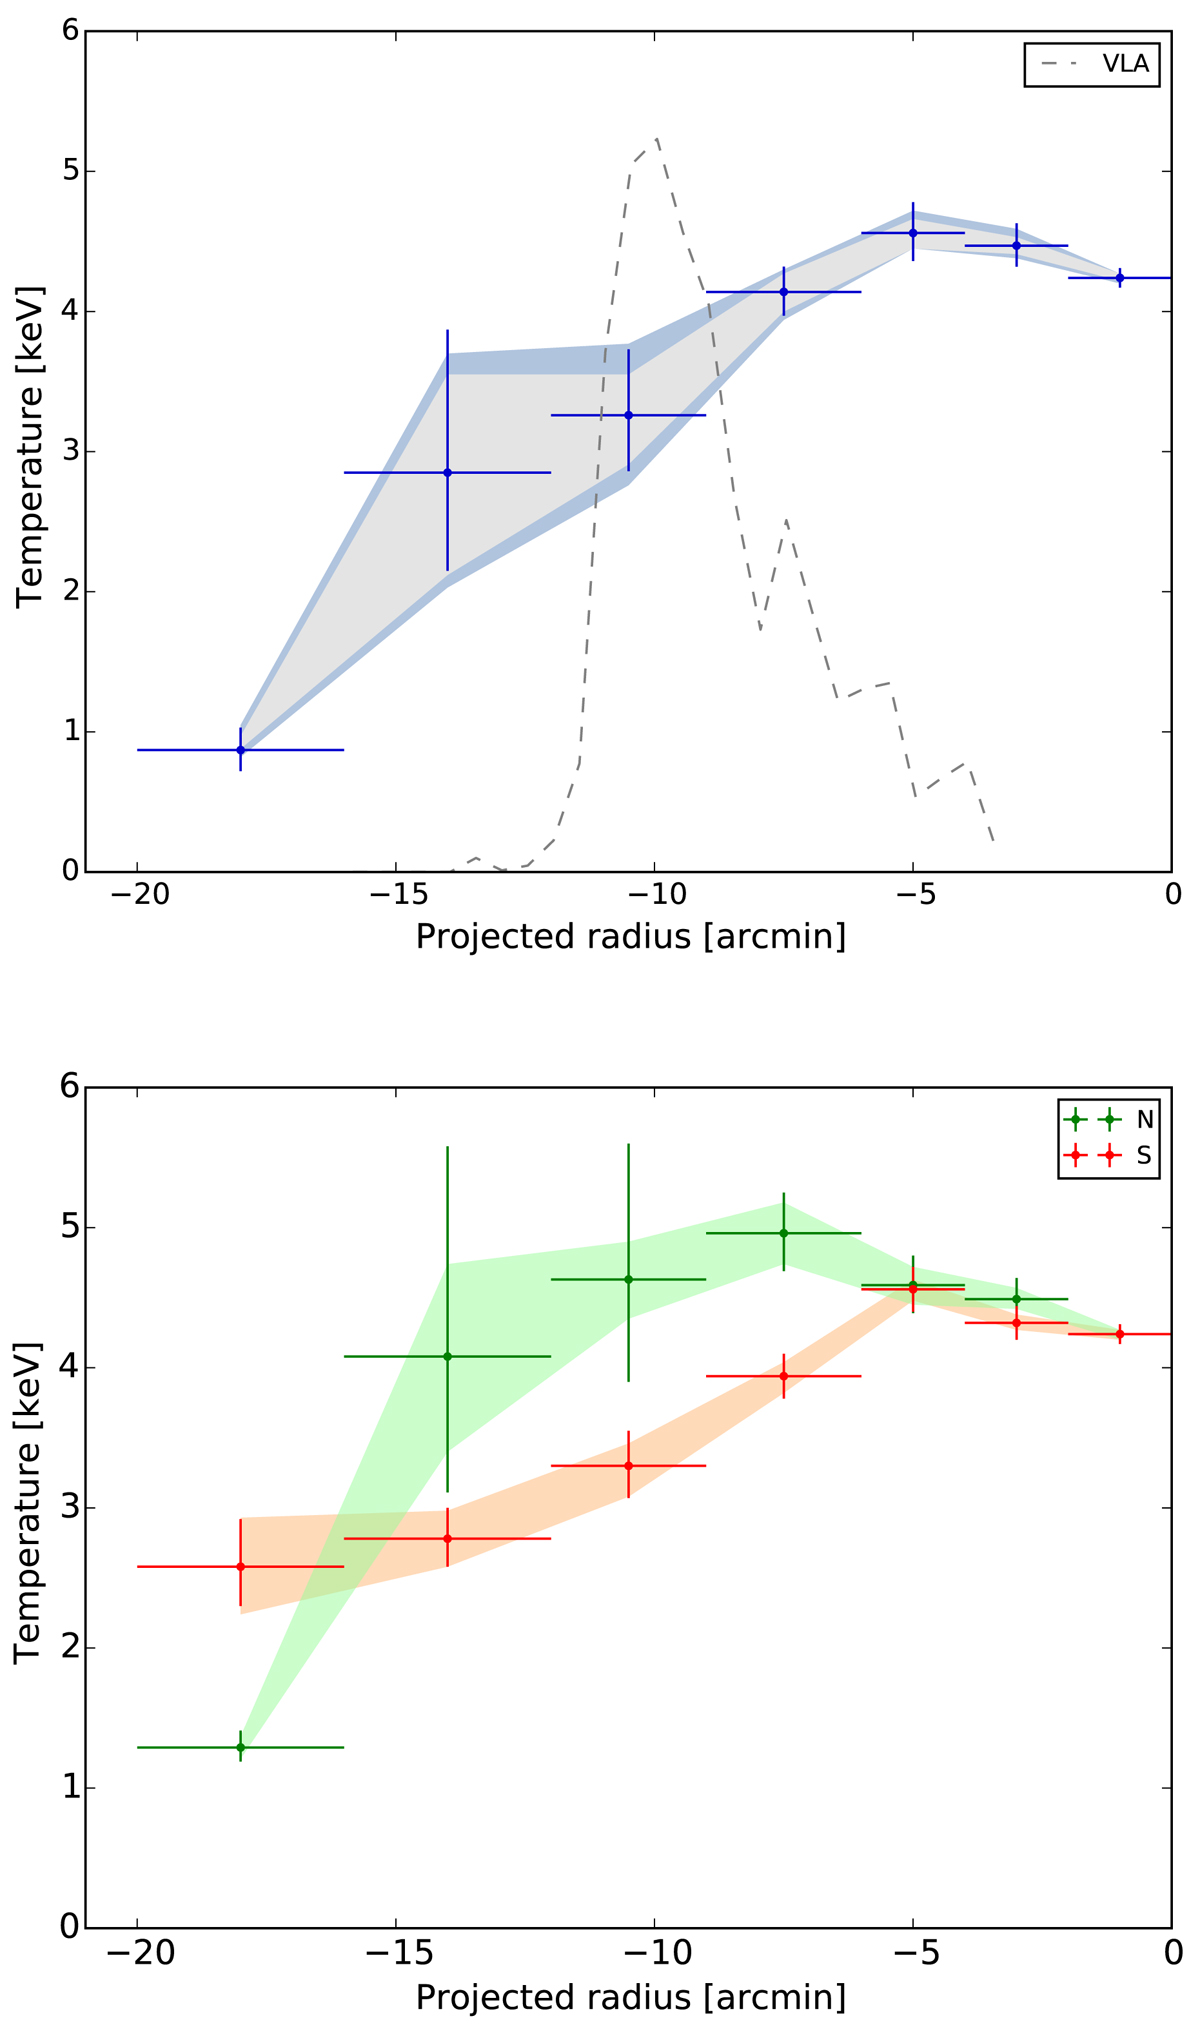
Radial temperature profile for the eastern region (top is east and bottom is north and south). Top: Gray and blue areas represent the CXB and NXB systematic uncertainties. The dashed gray line is the VLA radio radial profile. Bottom: Green and red areas represent the CXB and NXB systematic uncertainties for north and south, respectively.
Current usage metrics show cumulative count of Article Views (full-text article views including HTML views, PDF and ePub downloads, according to the available data) and Abstracts Views on Vision4Press platform.
Data correspond to usage on the plateform after 2015. The current usage metrics is available 48-96 hours after online publication and is updated daily on week days.
Initial download of the metrics may take a while.