Free Access
Fig. 7.
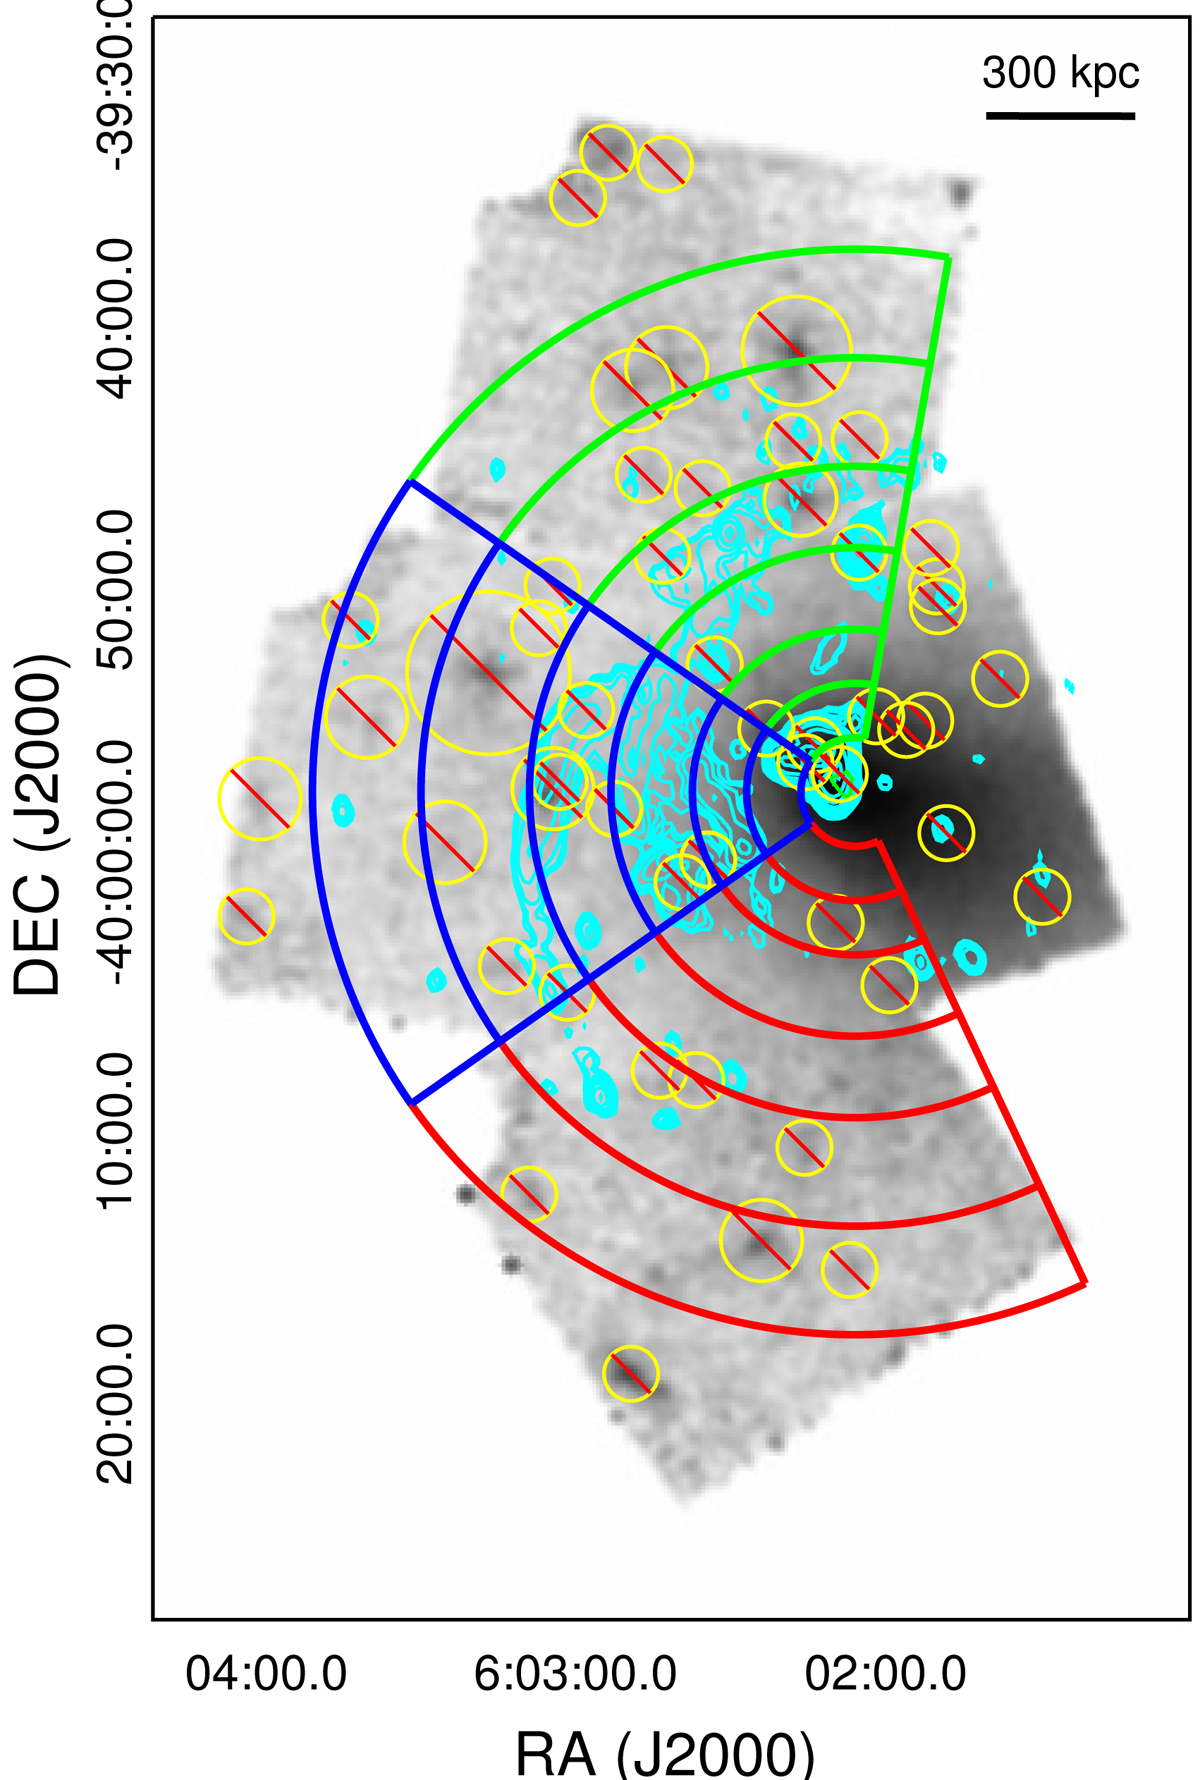
A3376 center, north, east, and south images in the band 0.5–10 keV. The cyan contours represent VLA radio observations. The yellow circles represent the extracted points sources. The green (north), blue (east) and red (south) annular regions are used for the spectral analysis detailed in Tables 6, 5, and 7, respectively.
Current usage metrics show cumulative count of Article Views (full-text article views including HTML views, PDF and ePub downloads, according to the available data) and Abstracts Views on Vision4Press platform.
Data correspond to usage on the plateform after 2015. The current usage metrics is available 48-96 hours after online publication and is updated daily on week days.
Initial download of the metrics may take a while.