Free Access
Fig. 5.
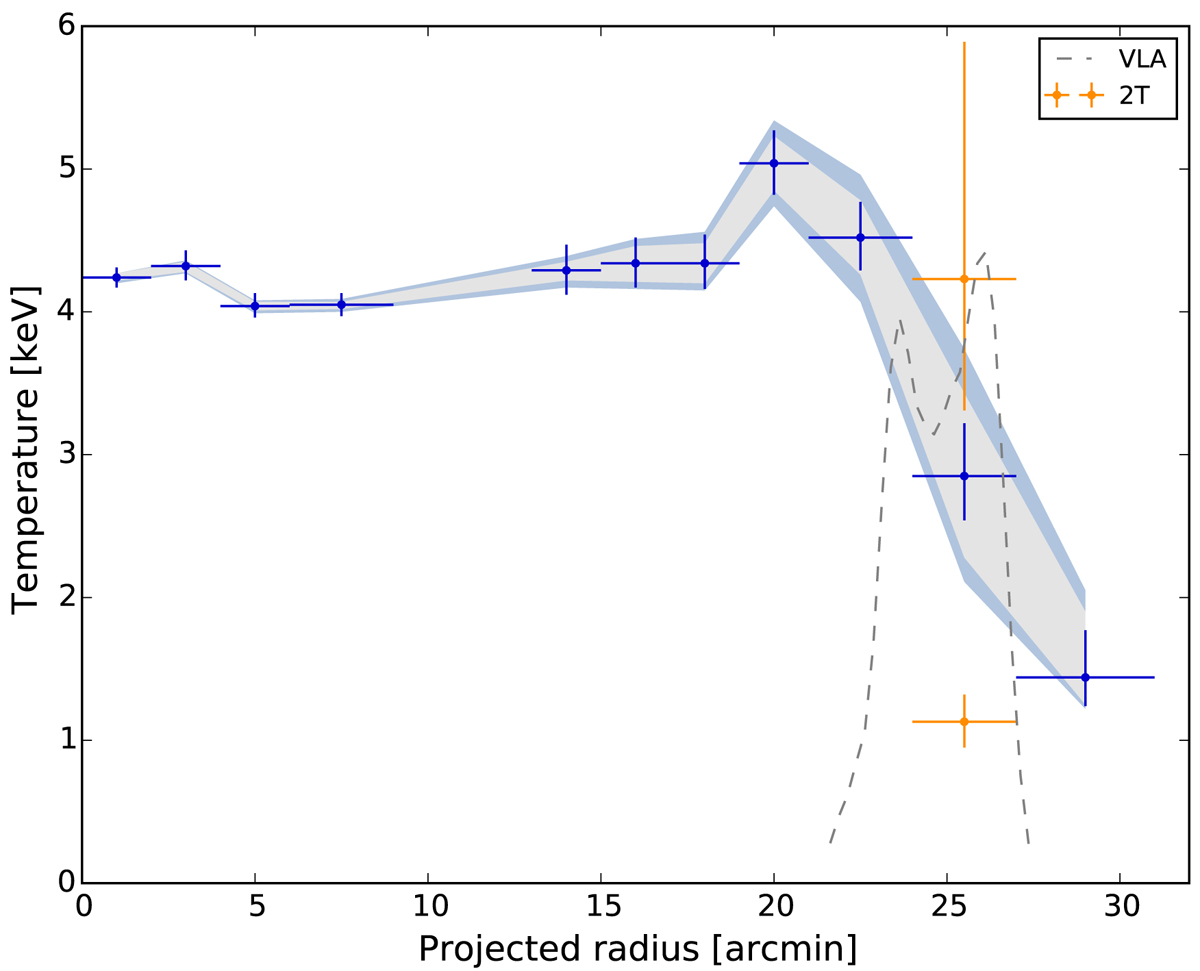
Radial temperature profile for the western region. The gray and blue area represent the CXB and NXB systematic uncertainties. The orange points show the 2T model temperatures at the western radio relic. The dashed gray line is the VLA radio radial profile.
Current usage metrics show cumulative count of Article Views (full-text article views including HTML views, PDF and ePub downloads, according to the available data) and Abstracts Views on Vision4Press platform.
Data correspond to usage on the plateform after 2015. The current usage metrics is available 48-96 hours after online publication and is updated daily on week days.
Initial download of the metrics may take a while.