Free Access
Fig. 19.
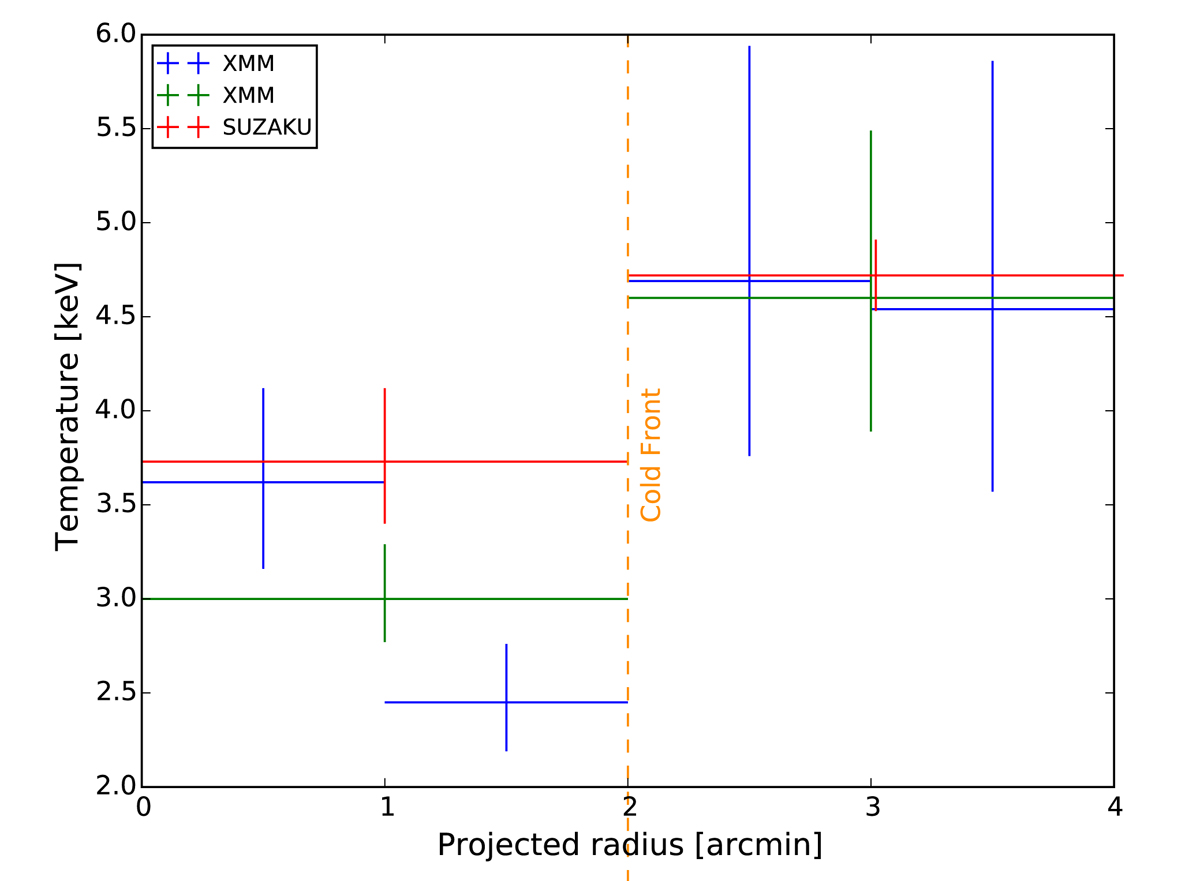
Radial temperature distribution for the red annular regions shown in Fig. 17. Blue and green crosses correspond to XMM-Newton observations and red crosses to Suzaku. The vertical orange line shows the estimated position of the cold front.
Current usage metrics show cumulative count of Article Views (full-text article views including HTML views, PDF and ePub downloads, according to the available data) and Abstracts Views on Vision4Press platform.
Data correspond to usage on the plateform after 2015. The current usage metrics is available 48-96 hours after online publication and is updated daily on week days.
Initial download of the metrics may take a while.