Fig. 16.
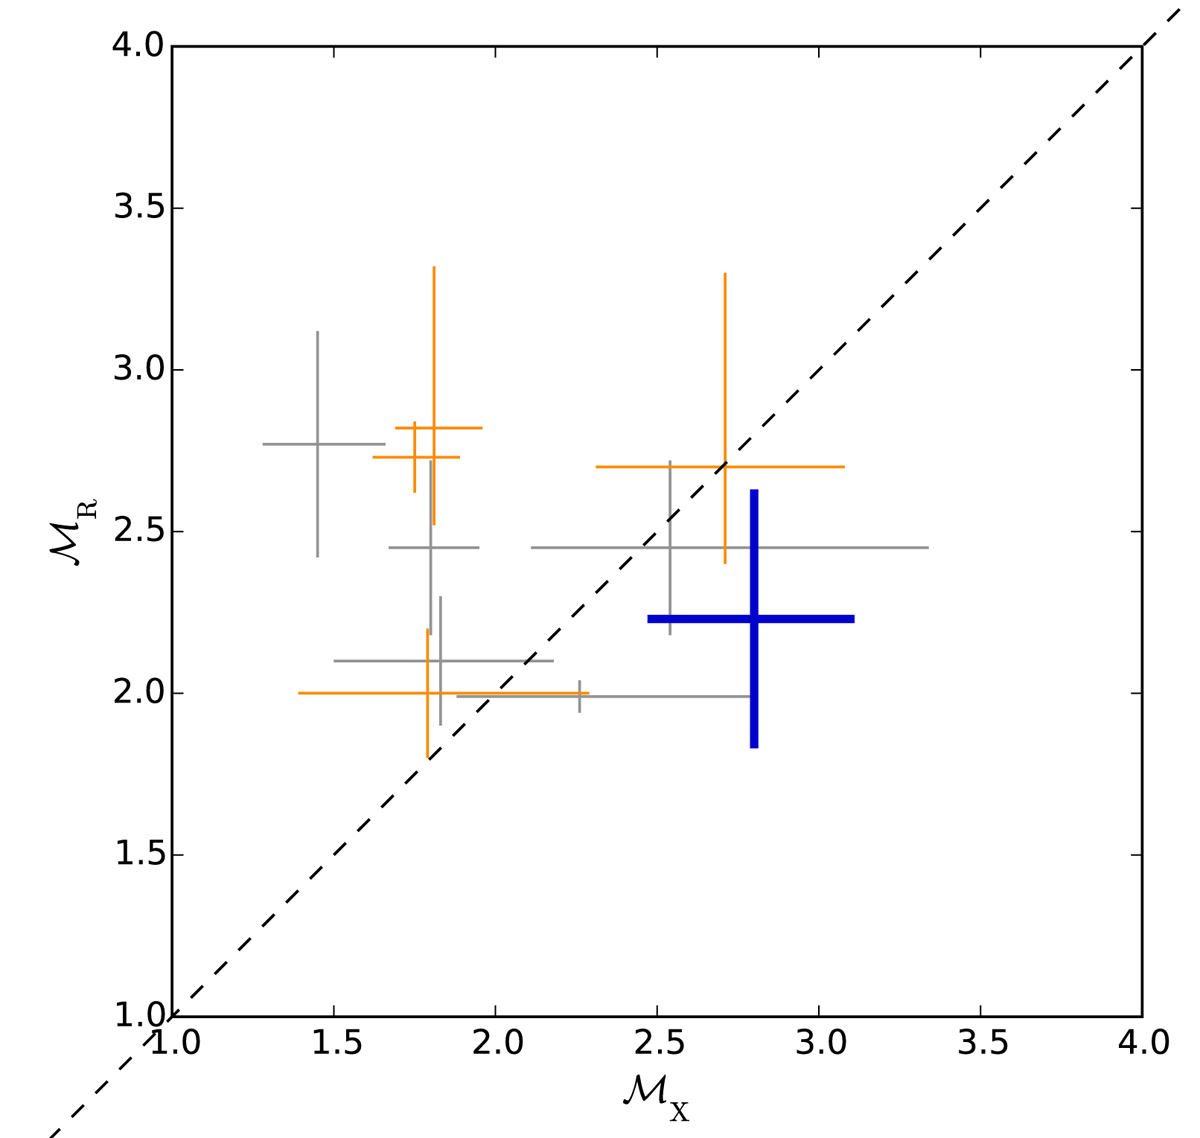
Comparison between Mach number derived from radio observations (ℳR) based on the radio spectral index and the X-ray observations (ℳX). The results for A3376 W is represented by the blue cross. The gray crosses show data for others clusters (see Table 10), orange crosses show recent radio observations done with LOFAR references. The black dashed line is the linear correlation used as reference.
Current usage metrics show cumulative count of Article Views (full-text article views including HTML views, PDF and ePub downloads, according to the available data) and Abstracts Views on Vision4Press platform.
Data correspond to usage on the plateform after 2015. The current usage metrics is available 48-96 hours after online publication and is updated daily on week days.
Initial download of the metrics may take a while.