Fig. 15.
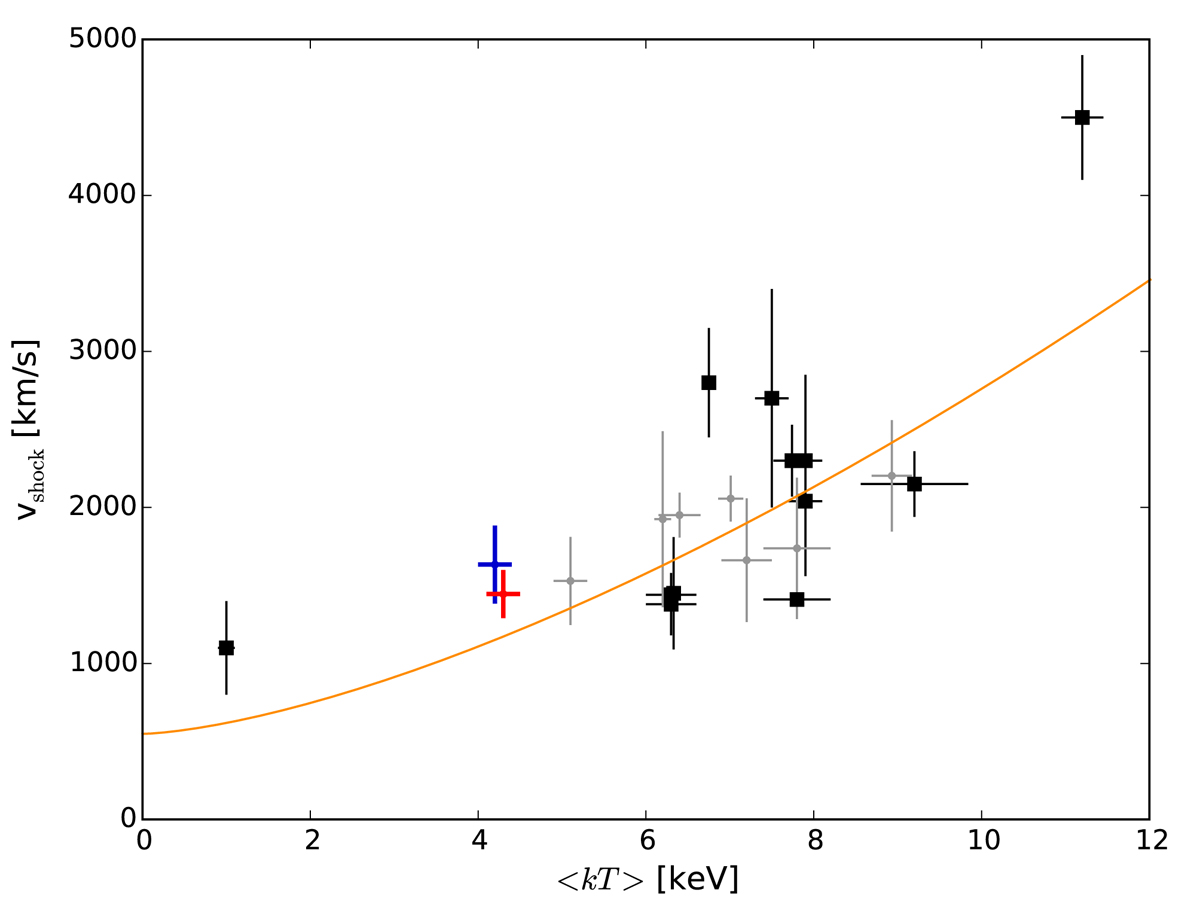
vshock correlation with ⟨kT⟩. The orange line is the best-fit for vshock = A * ⟨kT⟩(3/2) + B. Black crosses represent data taken directly from the literature (Akamatsu & Kawahara 2013; Akamatsu et al. 2015, 2017; Dasadia et al. 2016a; Eckert et al. 2016b; Markevitch et al. 2002, 2005; Russell et al. 2012, 2014; Sarazin et al. 2016). Gray points are the calculated data from ℳ and kT1 (Botteon et al. 2016a; Bourdin et al. 2013; Macario et al. 2011; Ogrean & Brüggen 2013; Owers et al. 2014; Sarazin et al. 2016; Trasatti et al. 2015) as explained in the text. Blue and red crosses correspond to the W and E shocks of A3376 as obtained in this work, respectively.
Current usage metrics show cumulative count of Article Views (full-text article views including HTML views, PDF and ePub downloads, according to the available data) and Abstracts Views on Vision4Press platform.
Data correspond to usage on the plateform after 2015. The current usage metrics is available 48-96 hours after online publication and is updated daily on week days.
Initial download of the metrics may take a while.